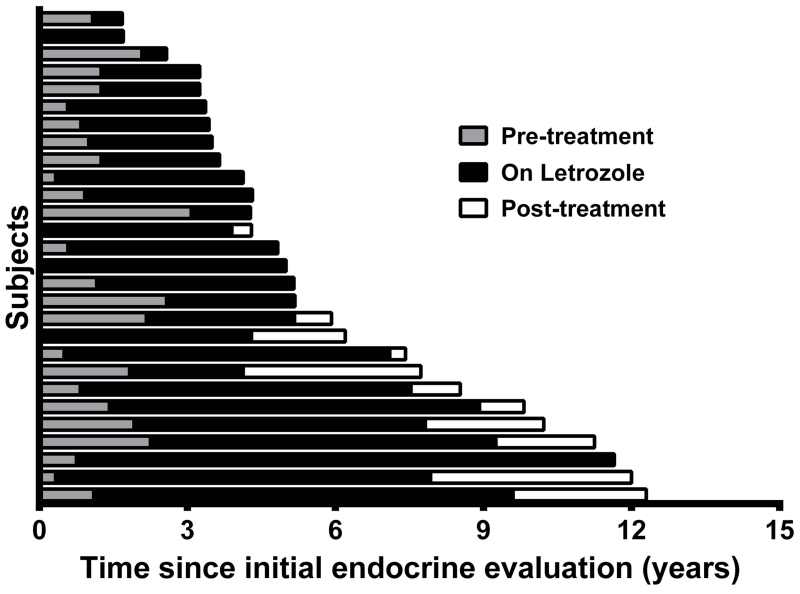
Figure 1. Duration of observation and treatment periods.
Horizontal bars indicate individual subjects, with gray bars representing the length of observation prior to initiating letrozole treatment, black bars representing the length of time on letrozole treatment, and white bars representing the on-treatment observation period following letrozole discontinuation.

