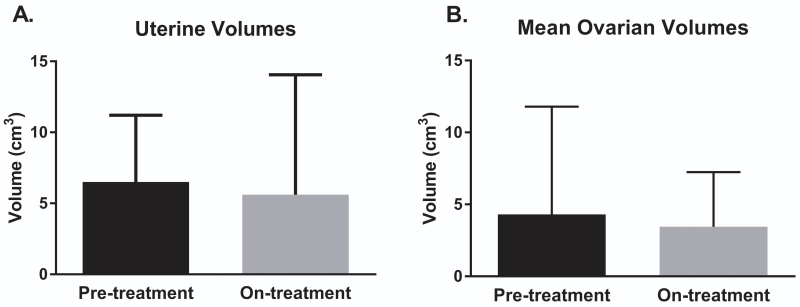
Figure 3. Uterine and mean ovarian volumes before and after letrozole treatment.
Pre- and on-treatment uterine volumes (panel A) and mean ovarian volumes (panel B) as determined by transabdominal pelvic ultrasound. There was no significant change in mean volumes for either parameter during the treatment period. Error bars represent the mean and one standard deviation. cm3 = centimeters cubed.

