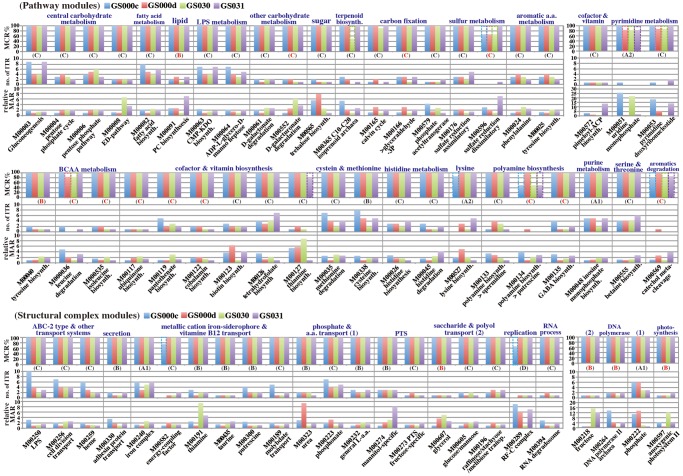
Figure 2.
Comparison of biodiversity contributing to the complete module and relative module abundance in the pathway and structural complex modules among the four GOS sites. The upper histogram shows MCR patterns of the KEGG module. The bars outlined by dashed lines indicate the MCRs of the WC. Uppercase characters A to D under the upper histogram show the module class used in Fig. 1, and ‘R’ indicates rare modules. The middle histogram shows the number of ITRs that completed the functional module. The lower histogram shows the relative module abundance ratio (MAR). The MAR was calculated by dividing abundance of each module by the minimum abundance among the four GOS sites. The modules showing 2-fold greater differences in the MAR among the four GOS sites are represented.

