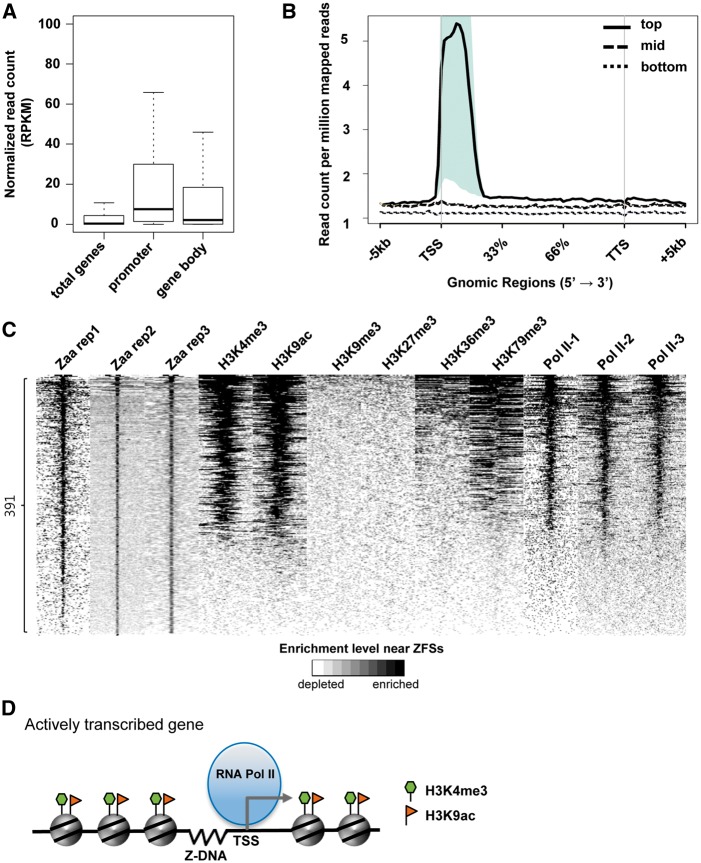
Figure 4.
Association of ZFSs with active transcriptional regions. (A) Gene expression analysis was performed. Public mRNA sequencing data were downloaded and mapped to the human reference genome. Each transcript was quantified and normalized using the RPKM (reads per kilobase per million). ‘Promoter’ or ‘Gene body’ indicates where the genes have the ZFS. (B) Genes were ranked based on their RPKM values and divided into three groups based on their expression: top (1,000 highest expressing genes, thick line), mid (1,000 genes between the top and bottom group, dashed line), bottom (6,661 unexpressed genes (RPKM = 0), dotted line). Reads of each Zaa replicate were normalized by Read count per million mapped reads and normalized reads were counted within 5 kb of the TSSs. Shaded regions indicate P-value < 0.05. (C) Heatmap showing the enrichment of various histone marks and RNA polymerase II at ZFSs. ZFSs were ranked by the enrichment of Zaa, calculated using normalized read counts in ZFS ± 3kb. The enrichment level is shown by the color scale (white: depletion, black: enrichment). (D) The correlation of Z-DNA with RNA polymerase II and histone marks is illustrated. In promoter regions of actively transcribed genes, Z-DNA is associated with RNA polymerase II and active histone marks such as H3K4me3 and H3K9ac.

