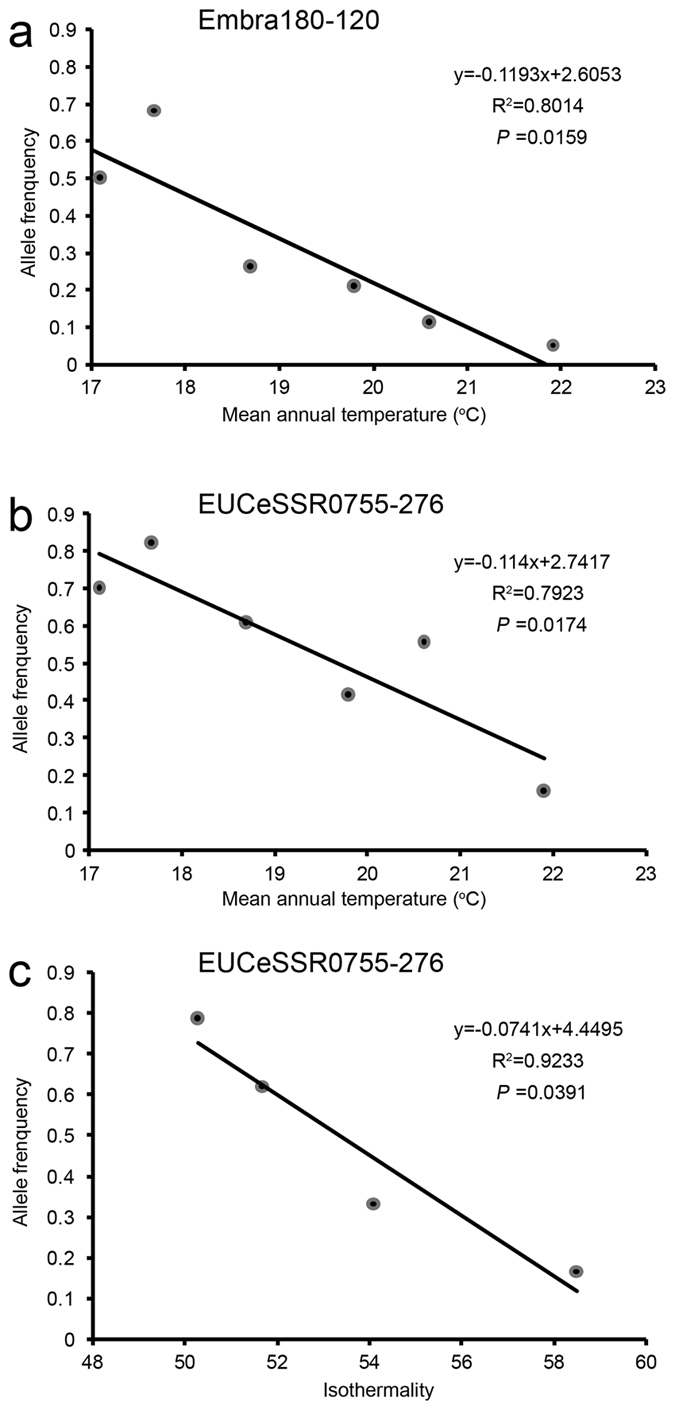
Figure 3. Linear regression for three significant associations between FST outlier allele frequencies and climatic variables.

Each dot represents a group of homogeneous populations in K-means climatic partition. (a) The 120 bp allele of locus Embra180 associated with mean annual temperature. (b,c) The 276 bp allele of EUCeSSR0755 associated with mean annual temperature and isothermality, respectively.
