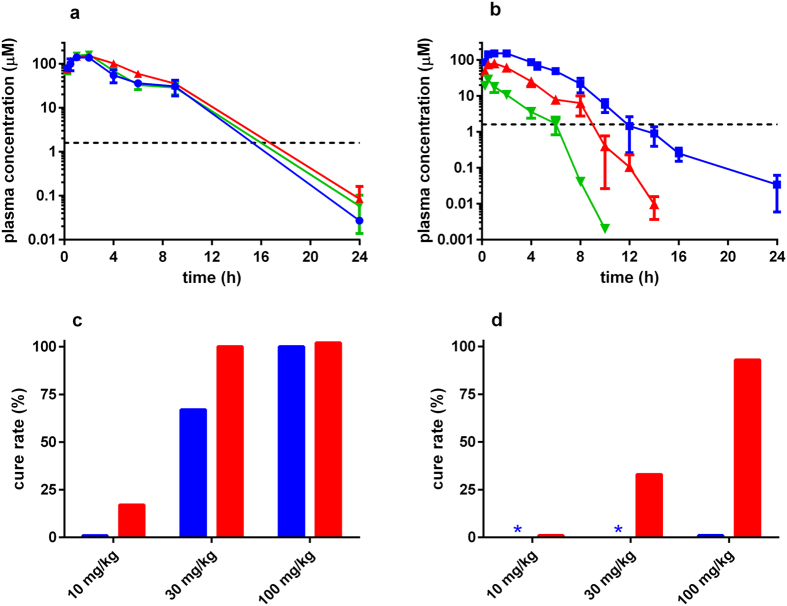
Figure 5. Pharmacokinetic and cure rate data for benznidazole.
(a) Plasma concentration versus time profiles of benznidazole following a single 100 mg kg−1 dose in uninfected (blue), acute (red) and chronic (green) stage infected BALB/c mice. The in vitro IC50 is shown by the dashed line. (b) Plasma concentration versus time profiles following single doses of 10 (green), 30 (red), and 100 (blue) mg kg−1 benznidazole in uninfected BALB/c mice. (c) Cure rates for benznidazole following 10 days (blue bar) and 20 days (red bar) treatment in chronic stage infected mice. (d) Cure rates for benznidazole following 10 days (blue bar) and 20 days (red bar) treatment in acute stage infected mice. Because 100 mg kg−1 was ineffective with 10 days treatment in the acute stage, 30 and 10 mg kg−1 treatments were not tested (blue asterisks).

