
Figure 6.
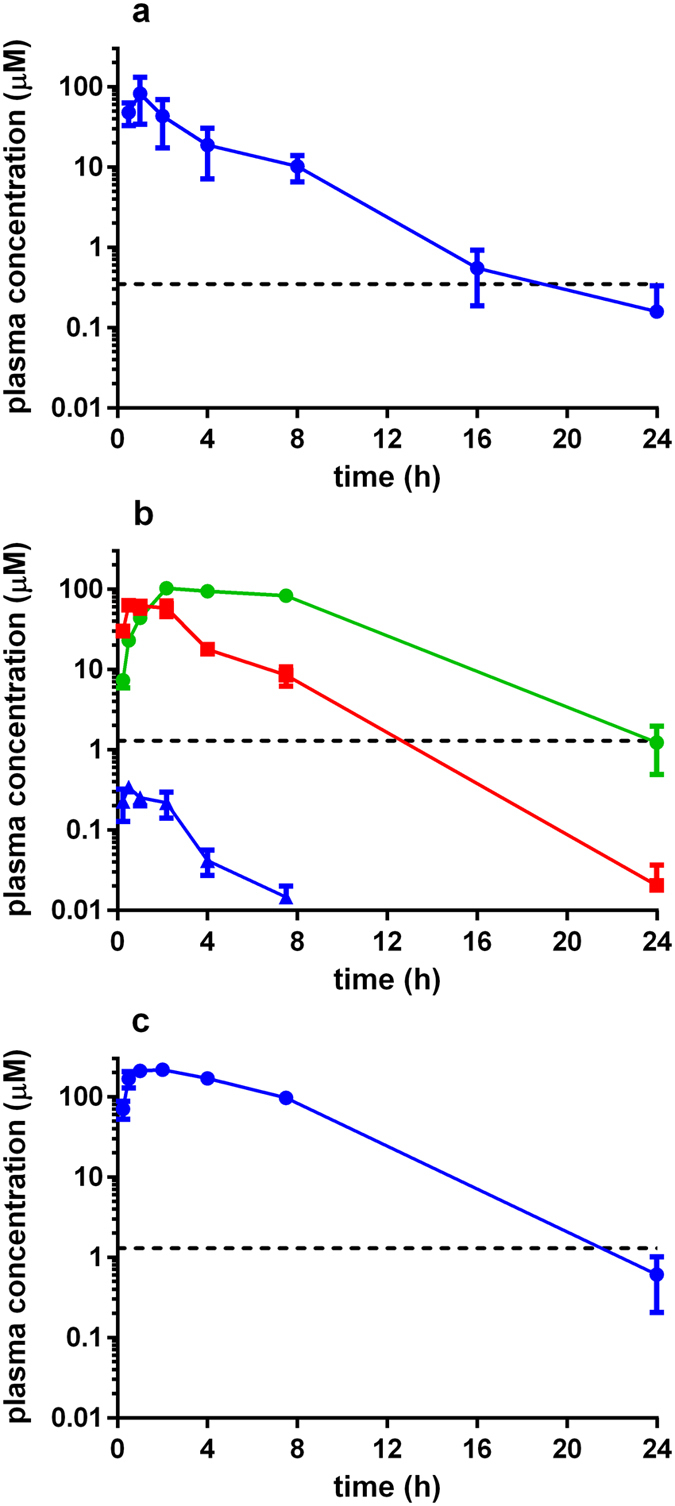
Pharmacokinetic data for (a) nifurtimox, (b) fexinidazole, and (c) fexinidazole sulfone following a single 100 mg kg−1 dose (Methods). For fexinidazole (b), profiles for the metabolites fexinidazole sulfone (green) and fexinidazole sulfoxide (red) are shown together with the parent compound (blue). Data for fexinidazole sulfone reproduced from ref. 27. The in vitro IC50 values are shown by the dashed lines.