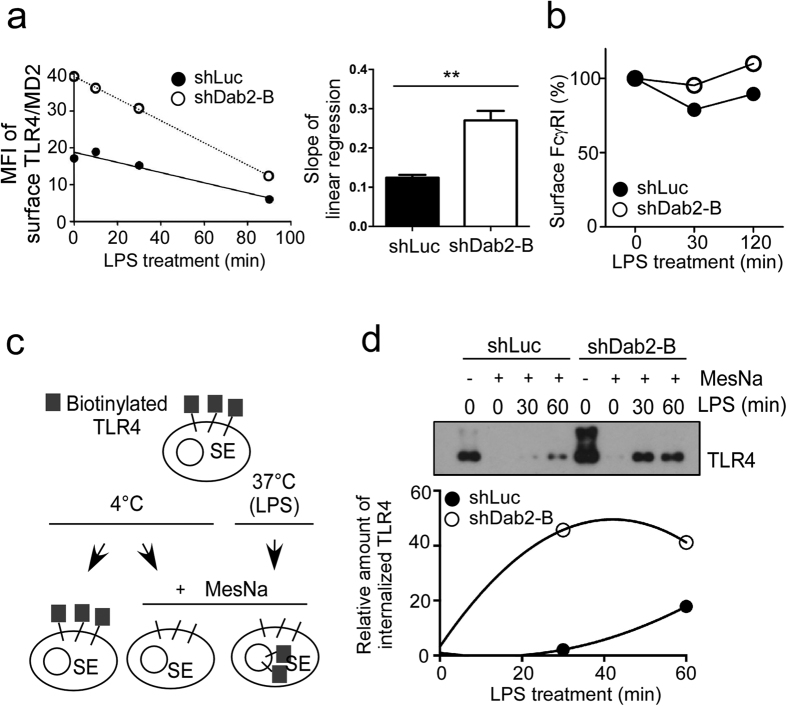
Figure 3. Loss of Dab2 accelerates LPS-stimulated TLR4/MD2 internalization.
(a,b) shLuc and shDab2-B cells were treated with LPS (100 ng/ml) for the indicated time. Flow cytometry was then performed to examine the surface levels of TLR4/MD2 complex and, as a negative control, FcγRI. The expression levels of the surface TLR4/MD2 complex (panel A, left) and FcγRI (panel B) were plotted. The slope for linear regression of the data representing the rate for TLR4/MD2 internalization was determined (panel A, right). Data represent the mean ± SEM of three independent experiments. **P < 0.01. (c) Schematic representation of the surface protein biotinylation analysis for quantitative assessment of TLR4 internalization. (d) The shLuc and shDab2-B cells treated with LPS (100 ng/ml) for the indicated time were subject to the surface protein biotinylation assay. The internalized proteins in the lysates were pulled down and analyzed by Western blotting using the anti-TLR4 antibody. Quantification for the changes of internalized TLR4 was performed by using the Image J analysis software. The relative levels of internalized TLR4 in shLuc or shDab2-B cells when compared with the MesNa-treated vehicle shLuc cells in a representative experiment are shown. The full Western blot and the corresponding positions of the molecular weight protein markers are presented in Supplementary Fig. S2.

