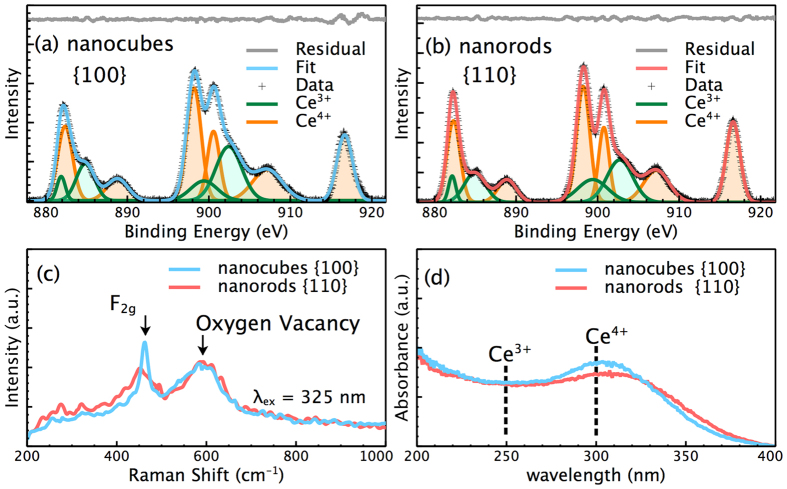
Figure 3.
(a,b) XPS spectra of the as-synthesized CeO2 nanostructures. The peaks in XPS spectra were fitted using Gaussian function and ascribed to Ce3+ and Ce4+, respectively. (c) Raman spectra of the as-synthesized CeO2 nanostructures at the excitation wavelength of 325 nm. (d) UV-Vis spectra of the as-synthesized CeO2 nanostructures.

