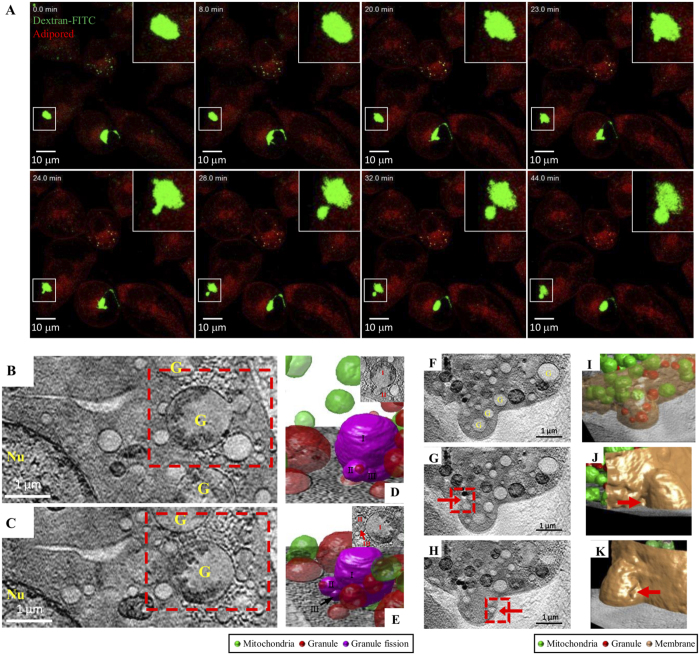
Figure 3. Granule dynamics in mast cell degranulation.
Cells were sensitized with anti-DNP IgE and then stimulated with DNP-BSA at different time points. (A) Fluorescence microscopy image of cells pre-stained with dextran-FITC (green) and adipored (red). Scale bars represent 10 microns. Cells were sensitized with anti-DNP IgE, and then stimulated with DNP-BSA for 3 min. (D,E,I–K) 3D structure reconstructions from SXT. (B,C,F–H) Segment images of cells in SXT reconstructions. (D,E) A magnification from the rectangle in panel (B,C) in different orientation. Arrow indicates a cavity in the membrane protrusion region. Granules: red; mitochondria: green; granule fission: violet; cell membrane: dark yellow. Scale bars represent 1 micron. Nu: nuclear; G: granule.

