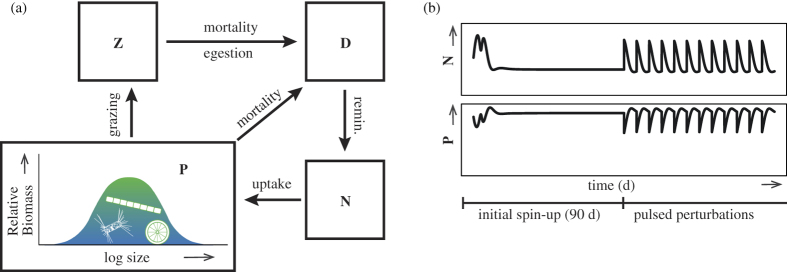
Figure 1.
Diagram of the plankton ecosystem model, control version (a), which includes compartments (boxes) for nutrient, N, phytoplankton, P, zooplankton, Z, and detritus, D. The functional diversity of phytoplankton is represented by their size distribution (assumed log-normal) combined with size-scaled trait values. (b) Schematic of the setup for simulations, each of which includes an initial spin-up period of 90 d, followed by pulsed mortality events with corresponding nutrient addtions of differing frequency and intensity. For details see the Supplementary online Methods.

