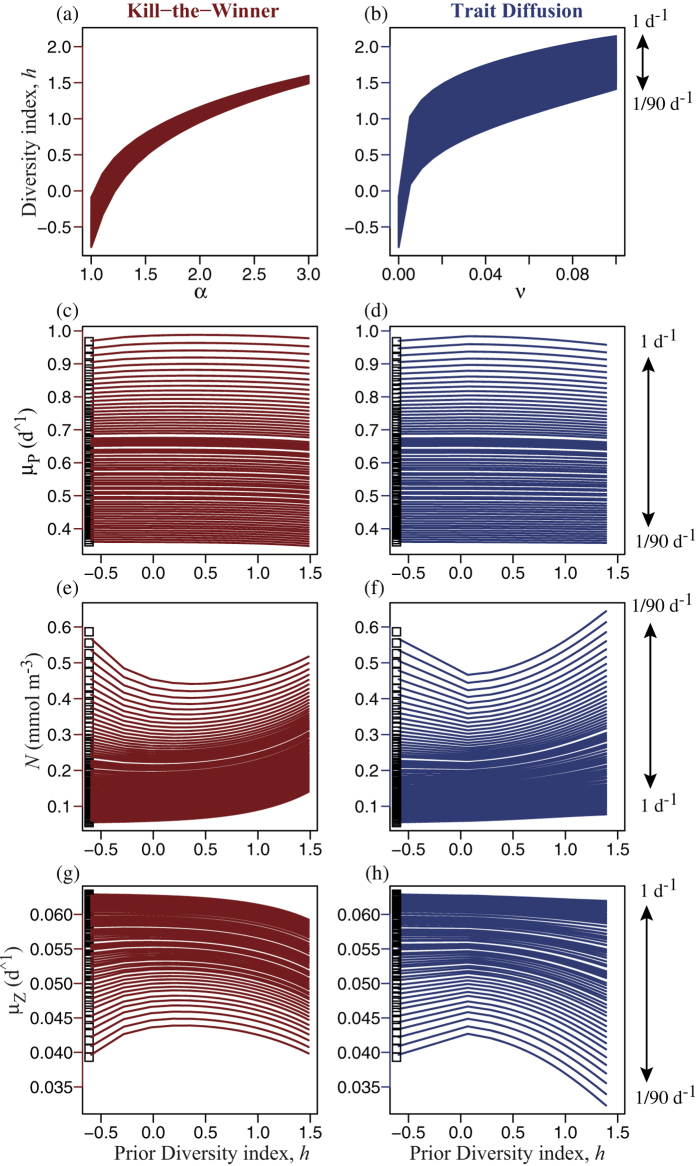
Figure 5.
Size diversity index, h, averaged over 90 d following the first disturbance versus the (a) KTW parameter α, and (b) TD parameter ν. Vertical arrows specify frequencies of disturbance. Long-term Productivity (LP) is quantified by avg. values over the same 90 d of: mean specific growth rate, μP, for the phytoplankton community (c,d), nutrient concentration, N (e,f), and specific growth rate of zooplankton, μZ (g,h), each plotted vs. the size diversity index before the first disturbance. White squares (left) show the corresponding values for the single size having the fastest avg. specific growth rate at each frequency.

