Figure 7.

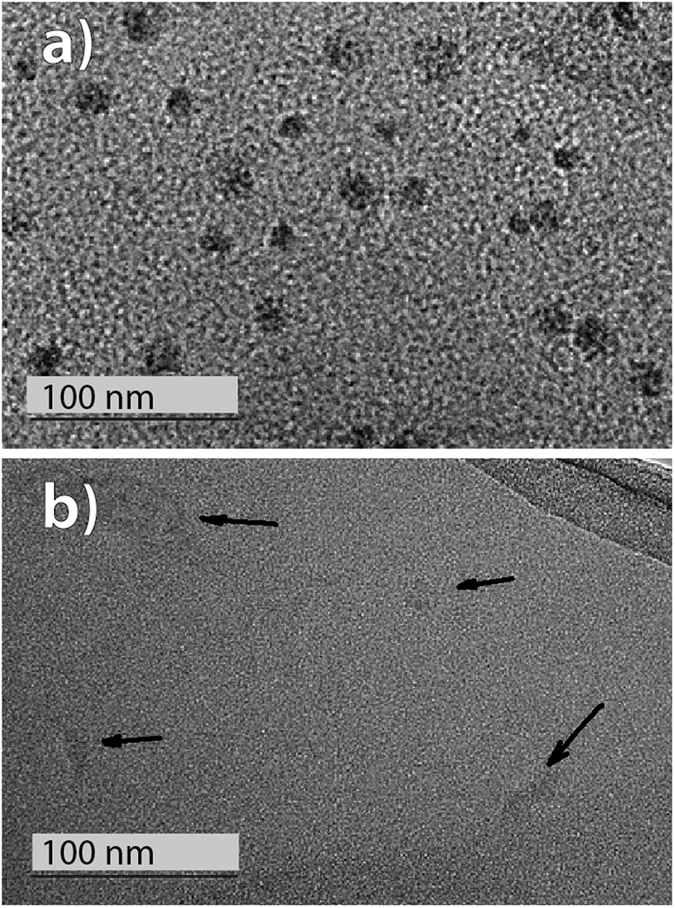
TEM images of individual (a) PCS and (b) PDMS molecules deposited directly on a microscopy grid. The black arrows indicate the PDMS molecules that are visible only in a low contrast.

TEM images of individual (a) PCS and (b) PDMS molecules deposited directly on a microscopy grid. The black arrows indicate the PDMS molecules that are visible only in a low contrast.