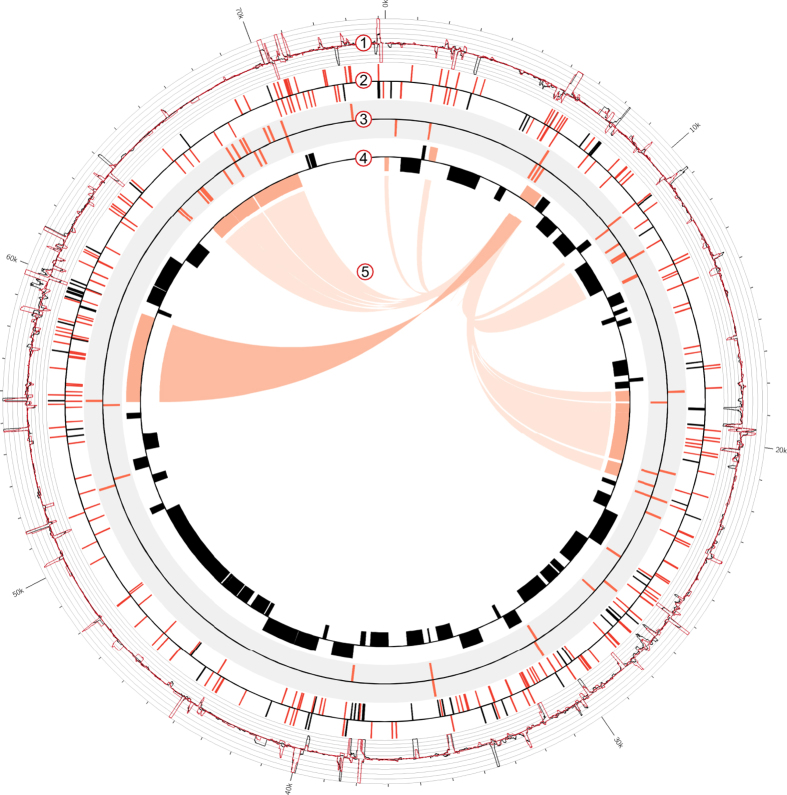
Figure 1. The transcriptome profile and the AggR regulon of the E. coli O104:H4 pAA plasmid.
Track 1: dRNA-seq profile of the pAA plasmid. The graphs represent the normalized number of pAA reads mapped per nucleotide in TEX+ (red) and TEX- (black) libraries (y-axis = abundance relative score, max. 100). Track 2. TSS (red) and PS (black) candidates mapped by dRNA-seq. Track 3. Computationally predicted AggR (red) binding sites. Track 4. Annotated ORFs in pAA (NC_018666.1). Virulence associated genes are colored in orange. Track 5. AggR regulon. The AggR regulon is based on Morin et al.16 (light orange) and our study (dark orange). The image was generated using Circos52.

