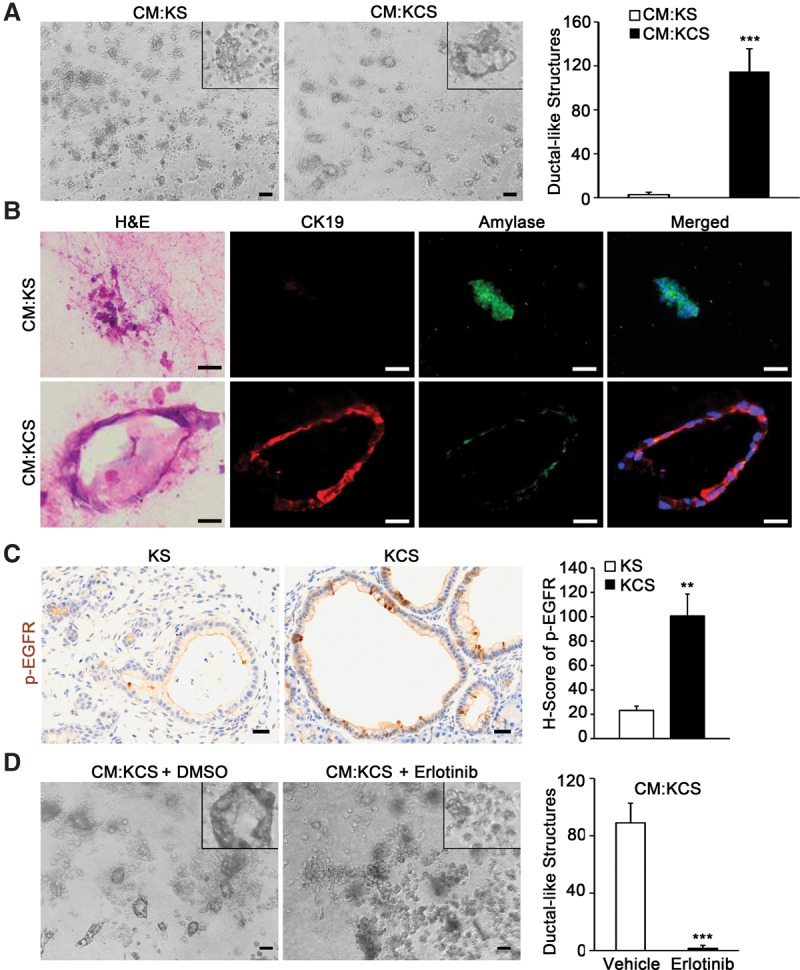
Figure 2.

Loss of SMO in pancreatic fibroblasts induces ADM in vitro. (A) Images and quantitation of ductal-like structures in 3D ADM formation assay treated with the indicated CM. Insets show a higher magnification view of representative cellular structures. The graph represents quantitation of ductal-like structures. Bar, 40 μm. n = 3. Error bars represent means ± SD. (B) Matched H&E and coimmunofluorescence images of representative cellular structures from 3D ADM formation assay stained for CK19 (red) and β-amylase (green) after treatment with the indicated CM. (C) IHC and quantitation of phosphorylated EGFR (Tyr1068). The graph represents quantification of the H score for each genotype. Bar, 25 μm. n = 3. Error bars represent means ± SD. (D) Quantitation of ductal-like structures in 3D ADM formation assay treated with KCS CM and DMSO or erlotinib. Bar, 40 μm. n = 3. Error bars represent means ± SD. (**) P < 0.01; (***) P < 0.001.
