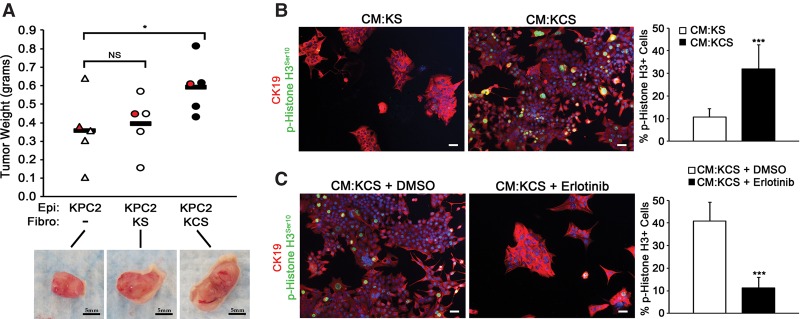
Figure 3.
Deletion of SMO in fibroblasts enhances tumor cell growth and proliferation through EGFR. (A) Quantitation of tumor mass 5 wk after implantation (tumors images are shown below the graph). Bar, 5 mm. n = 5. Each dot represents one tumor, and the red dot corresponds to the image below the graph. (B) Images and quantitation of the percentage of p-Histone H3+ over total CK19+ cells treated with the indicated CM. n = 3. Error bars represent means ± SD. (C) Images and quantitation of the percentage of p-Histone H3+ over total CK19+ cells cotreated with the indicated CM and DMSO or erlotinib. Bar, 40 μm. n = 3. Error bars represent means ± SD. (*) P < 0.05; (***) P < 0.001; (ns) not significant.

