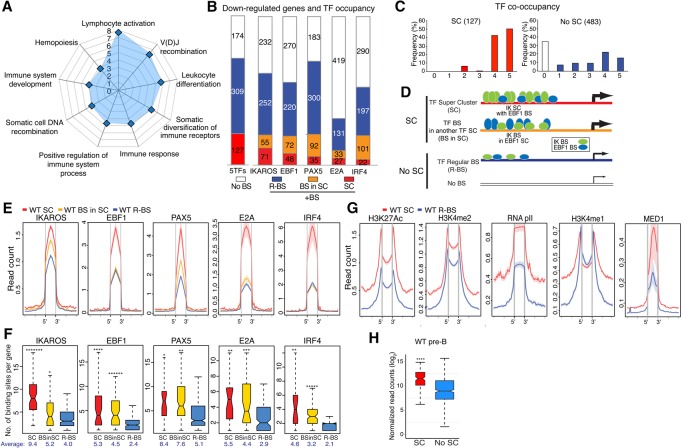
Figure 2.
IKAROS-based enhancer superclusters (SCs) support the large-to-small pre-B-cell transition. (A) Gene ontology (GO) of functional pathways for genes with superenhancers down-regulated in IkE5Δ/Δ (IKDN) stromal-adherent large pre-B cells and associated with IKAROS-binding sites in wild-type pre-B cells is shown. P-values (−log10 transformed) for pathway discovery are indicated. (B) Histogram depicting the frequency (in wild-type large pre-B cells) of occupancy by the indicated B-cell transcription factors of 610 genes down-regulated upon loss of IKAROS activity. Genes bound by a specific transcription factor are further subdivided by whether they are associated with regular binding sites (R-BS), binding sites in a SC configuration, or another factor's SC (BS in SC). The histogram at the left (5TFs) indicates the overall number of genes associated with any transcription factor SC (127), associated with a regular enhancer (R-BS; 309), or not associated with any transcription factor-binding sites (No BS; 174). (C) The frequency of occupancy of down-regulated genes with (SC) or without (no SC) SCs by the five transcription factors (from 0 to 5) is shown. (D) Schematic representation of idealized examples of IKAROS-binding sites (green ovals) in a SC configuration (SC), within a SC of another transcription factor (shown here as EBF1 in blue ovals; BS in SC), in a regular enhancer (R-BS), or in a gene with no binding sites (No BS) for these factors. The frequency of transcription factor occupancy is represented by the size of the ovals, whereas the relative density of binding sites is depicted by the number of ovals. The relative transcription level at these gene subsets is depicted by the thickness of an arrow at the transcription start site (TSS). (E) Comparative enrichment of transcription factors at binding sites associated with SCs ([red] SC; [yellow] BS in SC) or regular enhancers (R-BS) at down-regulated genes. Read densities (read count per million mapped reads) for IKAROS, EBF1, PAX5, E2A, and IRF4 are provided for wild-type pre-B cells. The start (5′) and end (3′) of transcription factor-binding sites are indicated. (F) Box plots depicting the distribution of the number of binding sites for the transcription factors in B at SCs, binding sites associated with SCs, and regular enhancer configurations. Box plot whiskers extend to 1.5 times the interquartile range. The average number of binding sites per gene subset is shown below each plot. P-values for differential distributions in the SC or BS in SC group relative to the R-BS group were obtained using an unpaired two-tailed t-test with variance determined by an F-test. Statistical significance compared with the R-BS subset are shown as P-values. (*******) P < 10−9; (******) P < 10−6; (*****) P < 10−5; (****) P < 10−4; (***) P < 10−3; (**) P < 10−2; (*) P < 0.05. (G) Comparative enrichment of permissive histone modifications (H3K27ac, H3K4me2, H3K4me1, RNApII, and MED1) at constituent SC-binding sites (SC) or regular binding sites (R-BS) as in D. (H) Expression in wild-type pre-B cells of down-regulated genes with or without SCs (SC or no SC) is shown in a box plot of log2 transformed normalized exonic read counts. Box plot whiskers extend to 1.5 times the interquartile range. A highly significant difference in expression between the two subsets in wild-type large pre-B cells is supported by a P-value of <10−4 (****) obtained by two-tailed unpaired t-test.

