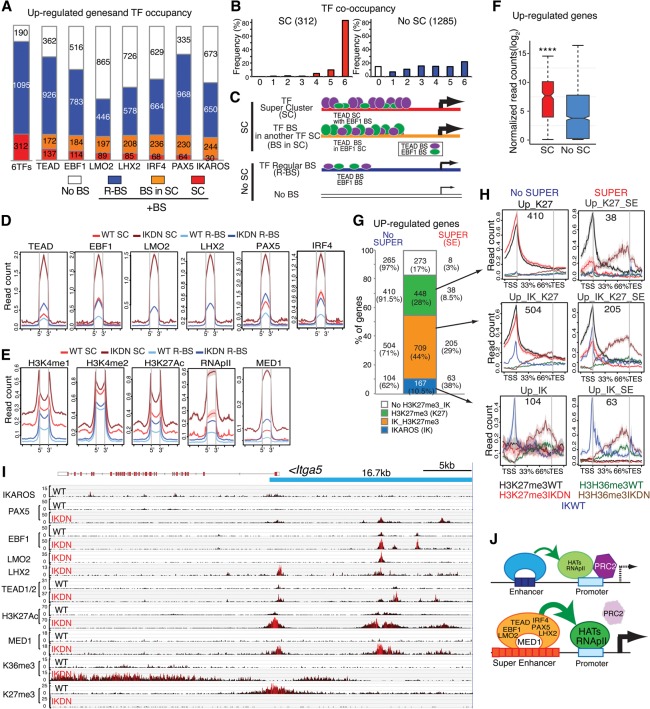
Figure 5.
Induction of de novo superenhancers and Polycomb eviction. (A) Histogram depicting the frequency (in IKDN large pre-B cells) of occupancy of 1597 up-regulated genes by the indicated extralineage and B-cell transcription factors. Genes bound by a specific transcription factor are further subdivided by whether they are associated with regular binding sites (R-BS) or binding sites in SCs (SC or BS in SC). (B) The frequency of transcription factor co-occupancy (from 0 to 6) in up-regulated genes with SCs or regular enhancer binding sites (R-BS) is shown. (C) Schematic representation of idealized examples of binding of TEAD (purple ovals) and EBF1 (green ovals) at up-regulated genes in a SC configuration (SC), within a SC of another transcription factor (BS in SC), or in a regular enhancer (R-BS) or at a gene with no binding sites (No BS). The frequency of transcription factor occupancy inferred from D is represented by the size of the ovals, while the relative density of binding sites obtained from Supplemental Figure 6D is depicted by the number of ovals. (D,E) Occupancy as determined by read density (read count per million mapped reads) for transcription factors (EBF1, PAX5, LMO2, LHX2, PAX5, and IRF4) (D) and histone modifications (H3K4me1, H3K4me2, H3K27ac) as well as RNApII and MED1 at transcription factor-binding sites in SCs or regular enhancers (R-BS) associated with up-regulated genes (E) is shown for wild-type ([red] SC; [light blue] R-BS) and IKDN ([brown] SC; [dark blue] R-BS) pre-B cells. (F) Expression in IKDN large pre-B cells of up-regulated genes with or without SCs (SC or No SC) is shown in a box plot of log2 transformed normalized exonic read counts. A highly significant difference in expression between the two subsets in IKDN large pre-B cells is supported by a P-value of <0.0001 (****) obtained by a two-tailed unpaired t-test. (G) Bar graph distribution of up-regulated genes (IKDN pre-B) subdivided into four groups according to their association with PRC2 activity (H3K27me3/K27) or IKAROS (IK) binding. Further subdivision of these subsets according to superenhancer association is provided by numbers and frequencies at the left (no SUPER) or right (SUPER/SE) side of the bar graph. (H) PRC2 (H3K27me3), transcriptional activity (H3K36me3), and IKAROS association are shown over the body of up-regulated gene subsets with (right column) or without (left column) superenhancers in wild-type and IKDN pre-B cells. (I) A 16.7-kb superenhancer contributed by EBF1, TEAD, and LMO2 at the 5′ prime end of the Itga5 gene is shown on the genome browser. ChIP-seq enrichment tracks are shown for IKAROS, PAX5, EBF1, LMO2, LHX2, TEAD (1/2), H3K27ac, MED1, H3K36me3, and H3K27me3. (J) Model of gene derepression by de novo enhancers and superenhancers in IKDN pre-B cells. Recruitment of permissive chromatin modifiers by the extralineage and B-cell transcription factors at enhancers and subsequent promoter interactions may support eviction of the PRC2-repressive complex. Cooperative interactions among transcription and chromatin regulators at superenhancers may augment this process, leading to rapid PRC2 eviction and gene activation.

