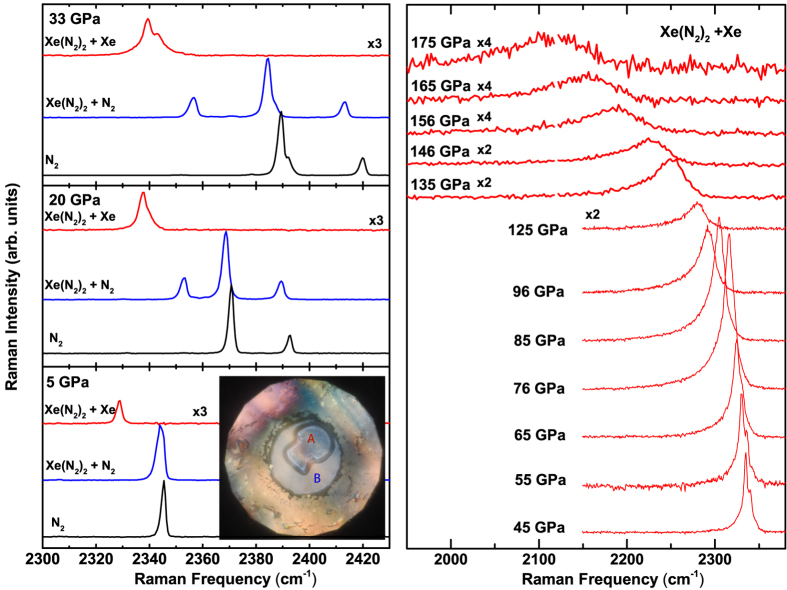
Figure 2.
(a) Representative vibrational Raman spectra of the Xe-N2 compound at 5, 20 and 33 GPa. Red spectra are from the formed compound in Xe media, whilst blue spectra show the compound formed in N2 media. As a comparison, vibrational spectra of pure N2 are shown in black. Inset: Photomicrograph of sample at 5 GPa. Red spectra were taken at position A in the single crystal and blue spectra were taken in the surrounding medium at position B. (b) Representative vibrational Raman spectra of Xe(N2)2 in a Xe matrix to pressures of 175 GPa.

