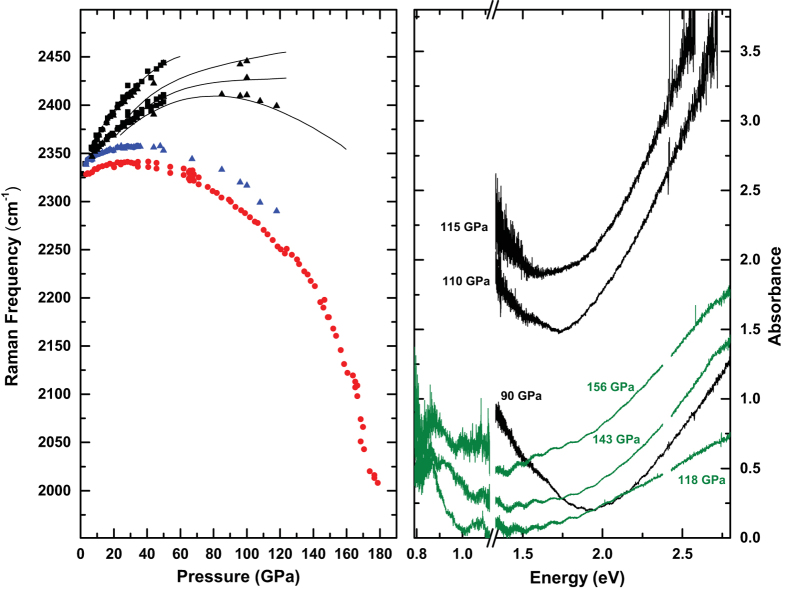
Figure 3.
Left Panel: Frequencies of the vibrational modes as a function of pressure. Xe(N2)2 Raman frequencies in Xe medium are shown in red, Xe(N2)2 Raman frequencies in N2 medium are shown in blue and black points are the Raman frequencies of the excess N2. Black lines are taken from a study on pure N21. Right Panel: Optical absorption as a function of energy for Xe-rich (black) and N2-rich (green) samples. The reference spectra were taken at 50 GPa in both experiments.

