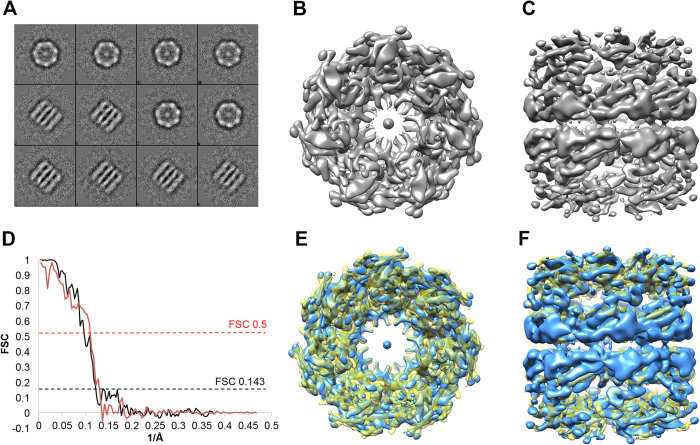
Figure 6. SPA of his6-GroEL captured from lysate.
(A) Class averages of his6-GroEL images captured from BSA-PABA-GO-NTA coated grids that were used to build the initial model; (B) Top and (C) side views of refined his6-GroEL EM map at 8.1 Å resolution (gold standard, 0.143 criteria); (D) Fourier Shell Correlations: gold standard using conservative masking (black), and cross-validation between published GroEL map EMD-5001 and our map (red); (E) Top and (F) side views of overlay with our his6-GroEL EM map (blue) and EMD-5001 (yellow)34.

