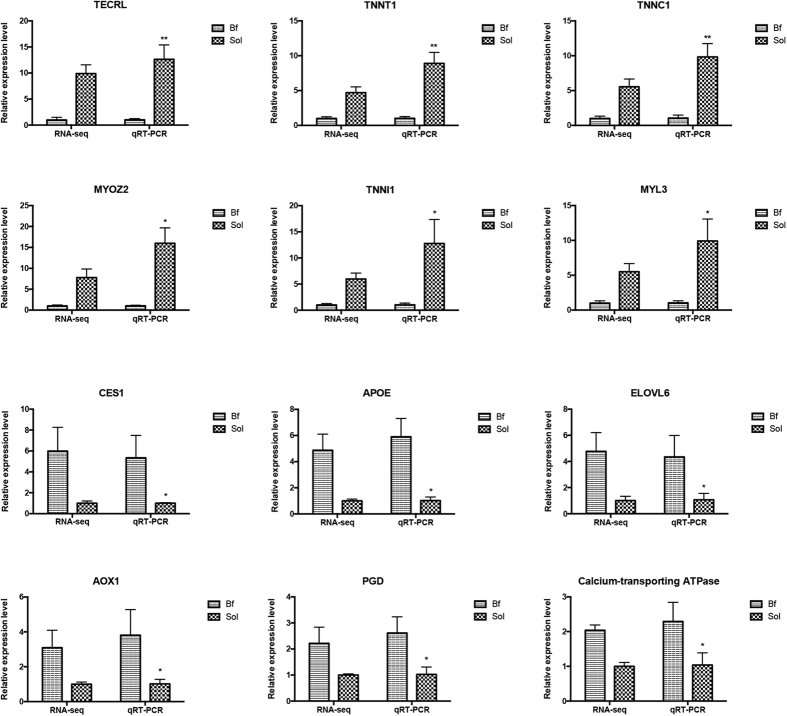
Figure 5. Validation of DEGs by real-time PCR.
Bf: Biceps femoris; Sol: Soleus. RPKM values are used to calculate the gene expression in RNA-seq and normalize the expression of one group to “1”. In real-time PCR, relative expression levels are calculated using ∆∆Ct value method and normalized by reference gene GAPDH, and similarly normalize the expression of one group to “1”. The data showed in Y axis represented the fold change. The unpaired Student’s t-test is used to evaluate the statistical significance of differences between the two groups, *P ≤ 0.05, **P ≤ 0.01. All data are presented as mean ± standard error (SE).

