
Figure 6. Heatmap analysis of DEGs between Bf and Sol muscles.
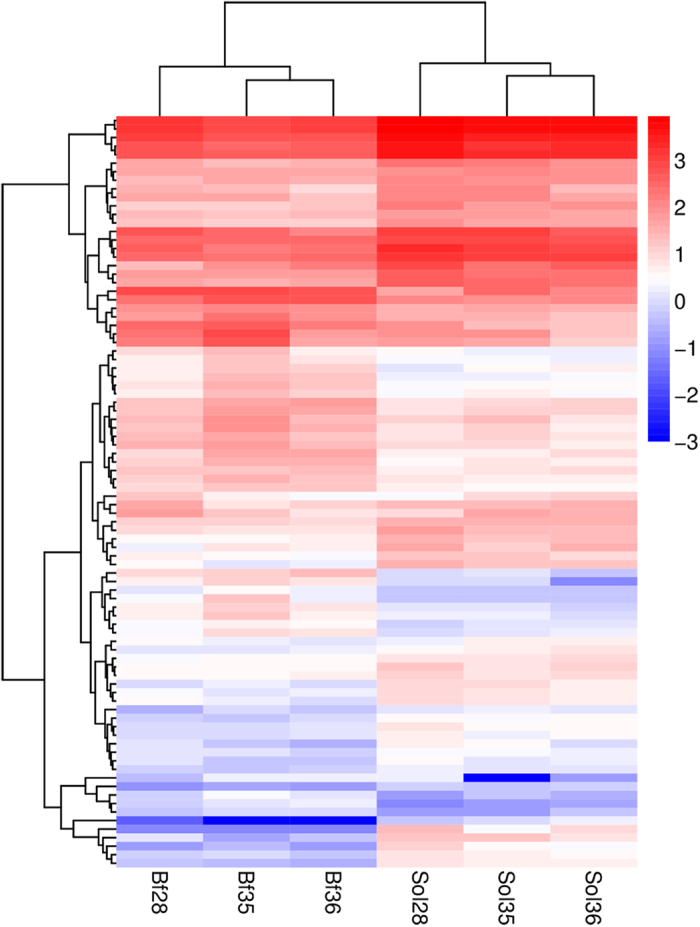
Heatmap analysis were conducted with 88 overlapped DEGs among three different comparative groups (Bf28-vs-Sol28, Bf35-vs-Sol35 and Bf36-vs-Sol36). Each column represents a sample, and each row represents a DEG. Red and blue gradient indicate an increase or decrease in gene expression abundance, respectively. The corresponding DEGs are showed in Supplementary Table S9.