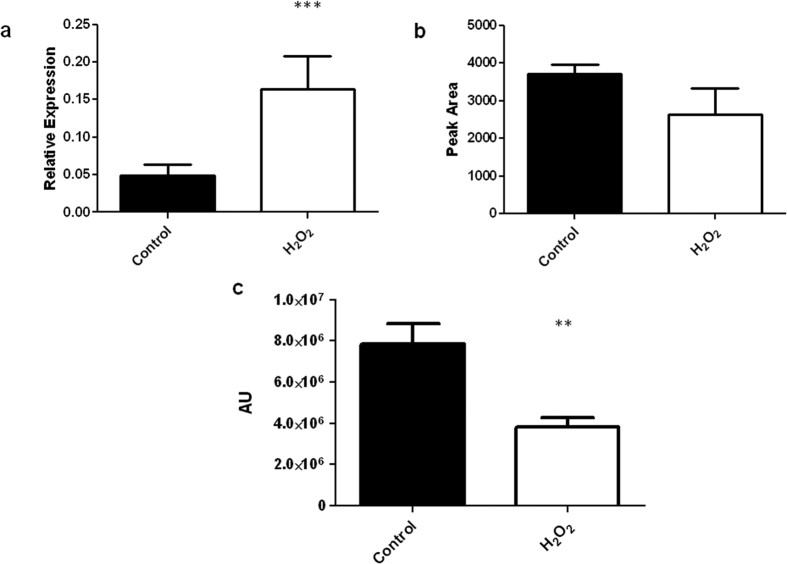
Figure 6. egtA expression and EGT detection following 3 mM H2O2 exposure.
(a) Quantitative RT-PCR data showing the relative expression of egtA in ATCC26933 following exposure to 3 mM H2O2. egtA levels are significantly (P = 0.0002) increased in ATCC26933 when exposed to H2O2 compared to control levels. (b) RP-HPLC analysis of 5′-IAF labelled EGT following ATCC26933 exposure to 3 mM H2O2. No significant variation in EGT levels was observed in H2O2 samples compared to control. (c) RP-HPLC data showing peak area of 5′-IAF labelled EGT following purified EGT incubation with 3 mM in H2O2. EGT levels drop significantly (P = 0.029) following 3 h reaction with 3 mM H2O2.

