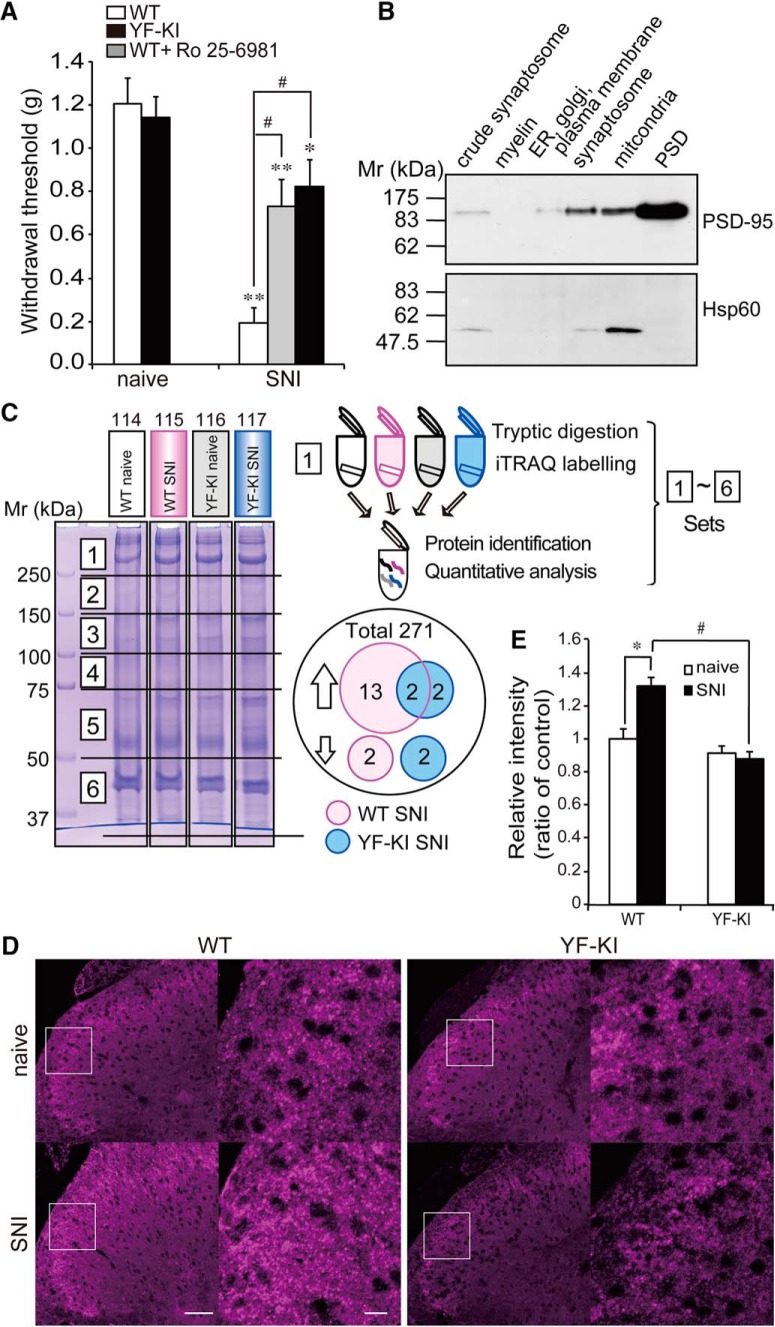
Figure 1.
Behavioral analysis and identification of BEGAIN as a neuropathic pain–related protein in the postsynaptic density (PSD) fraction. A, Attenuation of mechanical allodynia by inhibition of NMDAR containing GluN2B. Withdrawal thresholds of WT and Y1472F-KI (YF-KI) mice were assessed before and 7 days after SNI by use of von Frey filaments. The effect of the GluN2B antagonist Ro 25-6981 (100 μg/mouse) 7 days after SNI was assessed, and measurements were repeated three times within 30 and 90 min after i.t. injection of Ro 25-6981 at an interval of at least 15 min. The average was used as the value of the withdrawal threshold. Data are expressed as the mean ± SEM, n = 12. Significant differences are indicated: Mann–Whitney U test, *p < 0.05, **p < 0.01 vs. naive mice; #p < 0.01 vs. WT SNI mice. B, Purity of PSD fraction. PSD fractions were purified by sucrose-density gradient centrifugation and analyzed by Western blotting with anti–PSD-95 and anti-Hsp60 antibodies. PSD-95 is a marker protein of the PSD (upper panel), and Hsp60, for mitochondria (lower panel), as described in Materials and Methods. C, SDS-PAGE of PSD fractions and workflow for quantitative proteomics using iTRAQ reagents. PSD fractions of four comparison groups were individually separated into six parts by 10% SDS-PAGE after Coomassie Brilliant Blue (CBB) staining. Proteins in each gel piece were digested and labeled with 4-plex iTRAQ reagents (114: WT naive/white, 115: WT SNI/magenta, 116: YF-KI naive/gray, and 117: YF-KI SNI/blue). Differentially labeled peptide samples in the same part were combined and subjected to subsequent protein identification and quantitative analysis. As a result of examination of all six parts, 271 proteins were identified and quantified. D, Immunohistochemistry of BEGAIN in the spinal dorsal horn before and after SNI. Transverse sections (14 μm) of lumbar spinal cords prepared from WT and Y1472F-KI (YF-KI) mice before (naive) and 7 days after SNI were immunostained with anti-BEGAIN antibody. Higher magnification of the white boxes in the left images is shown as the right images. Scale bars, 50 and 10 μm. E, Quantification of immunoreactivity of BEGAIN. Immunostaining intensity of WT and YF-KI was measured by using ImageJ. The intensity of immunofluorescence for the WT naive mice was taken as 1, and the data are expressed as the mean ± SEM (n = 23–31 slices from three mice for each group). Significant differences were determined by Mann–Whitney U test: *p < 0.05 vs. WT naive mice, #p < 0.05 vs. WT SNI mice.

