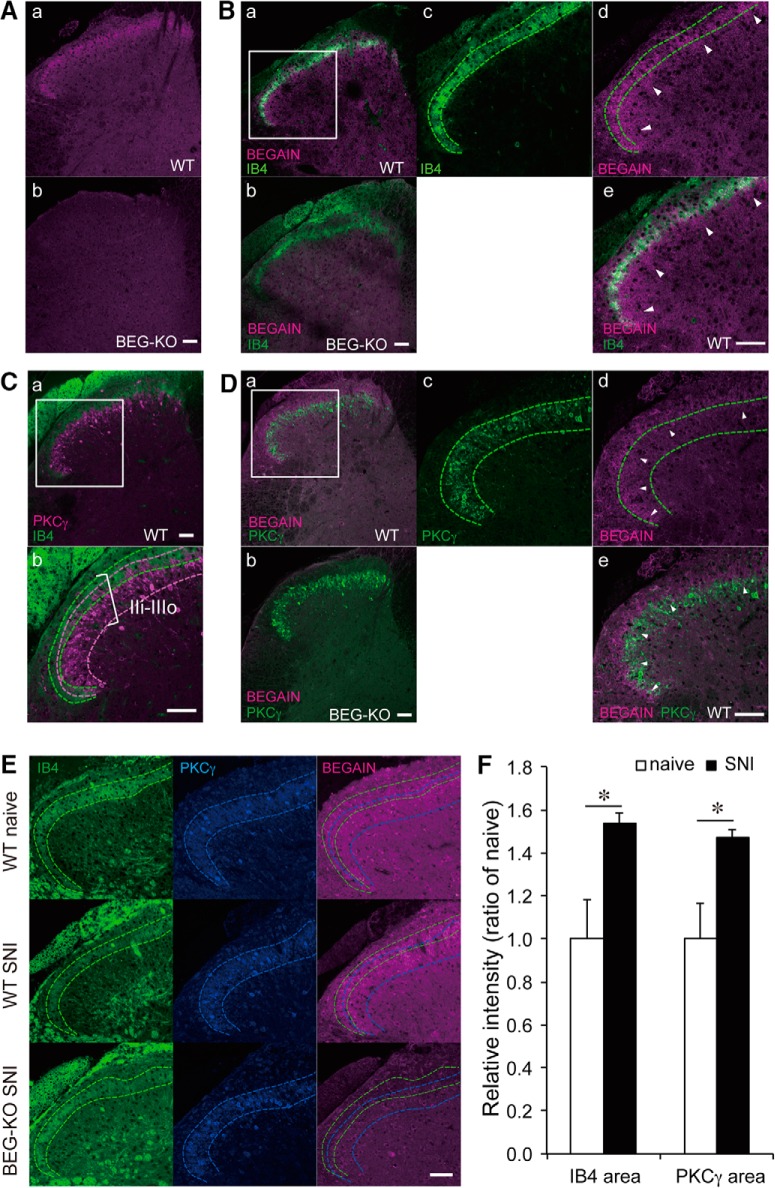
Figure 4.
Localization of BEGAIN in the spinal dorsal horn. A, Detection of BEGAIN in the spinal dorsal horn. Transverse sections (14 μm) of lumbar spinal cords prepared from WT (a) and BEGAIN-KO (BEG-KO; b) mice were immunostained with anti-BEGAIN antibody. B, Double-staining of the spinal dorsal horn of WT (a, c–e) and BEG-KO (b) mice by using anti-BEGAIN antibody and IB4, a marker of nonpeptidergic afferents in lamina IIi. c–e, High magnification of the white box in a. Green lines indicate IB4-positive area. Arrowheads indicate BEGAIN single-positive area (d and e). C, Lamina IIi–IIIo, labeled with IB4 and anti-PKCγ antibody in WT mice (a and b). Higher magnification of the white box in a is shown in b. Green and magenta lines indicate IB4- and PKCγ-positive areas, respectively. D, Double-staining of the spinal dorsal horn of WT (a, c–e) and BEG-KO (b) mice by use of anti-BEGAIN and PKCγ antibodies. Green lines indicate PKCγ-positive area. Arrowheads indicate BEGAIN and PKCγ double-positive area (d and e). E, Triple-staining of the spinal dorsal horn of WT naive, WT SNI, and BEG-KO SNI. Green and blue lines indicate IB4- and PKCγ-positive areas, respectively. Scale bars, 50 μm. F, Quantification of immunostaining intensity of BEGAIN in IB4- and PKCγ-positive areas. The signal of BEGAIN in each area was measured before and after SNI by using ImageJ. The intensity of immunofluorescence for the naive mice was taken as 1, and the data are expressed as the mean ± SEM (n = 31–39 slices from three mice for each group). Significant differences, determined by use of Mann–Whitney U test, are indicated: *p < 0.05 vs. WT naive mice.

