Figure 6.
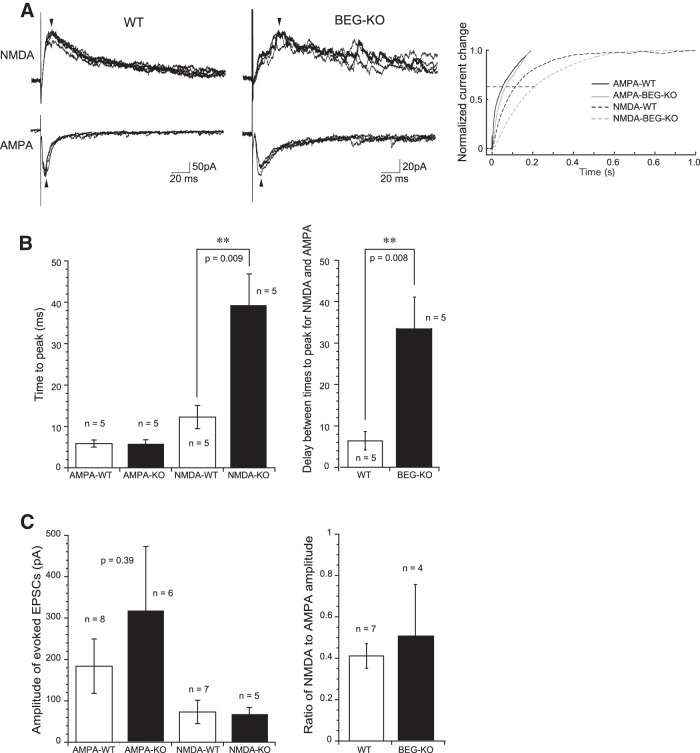
Change in the rising phase of evoked NMDAR EPSCs, but not that of AMPAR EPSCs, in SG neurons of BEGAIN-KO mice. A, Examples of evoked AMPAR and NMDAR EPSCs in WT (left traces) and BEGAIN-KO (BEG-KO; middle traces) mice. NMDAR EPSCs in KO mice had a slower kinetics than those in WT mice. The EPSC amplitude of the traces was not similar. However, there is no significant difference of the EPSC amplitude between the two groups (see Results). Arrows show peaks for the evoked EPSCs. The right graph shows normalized summation of current changes of the traces shown in the left and middle traces. Note that delay between the time constants (0.63, indicated by dashed line) for AMPAR and NMDAR EPSCs in BEG-KO mice is nearly twice that in WT mice. B, Summary showing time to peak for AMPAR and NMDAR EPSCs (left graph), and delay between times to peak for AMPAR and NMDAR EPSCs elicited in single SG neurons (right graph) in WT and BEG-KO mice. C, Amplitude of evoked EPSCs (left graph) and ratio of NMDAR to AMPAR EPSC amplitude (right graph).

