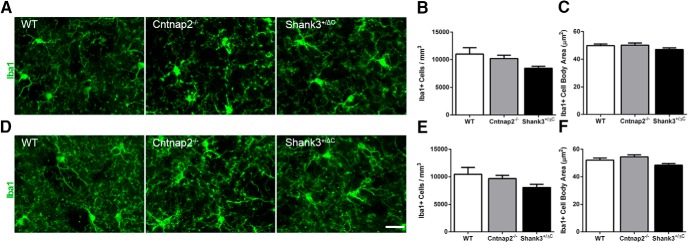
Figure 13.
No consistent differences were observed in Iba1-labeled microglia number and cell body size across mouse models in the dorsal striatum. A, D, Representative images of sections immunolabeled with Iba1 (green) from WT, Cntnap2−/−, and Shank3+/ΔC mice in the DLS (A) and DMS (D). Scale bar, 20 µm, applies to all frames. B, E, Quantification of the density of Iba1-labeled microglia in the DLS (B) and DMS (E). C, F, Quantification of the cell body area of Iba1-labeled microglia in the DLS (C) and DMS (F). Error bars represent the SEM.

