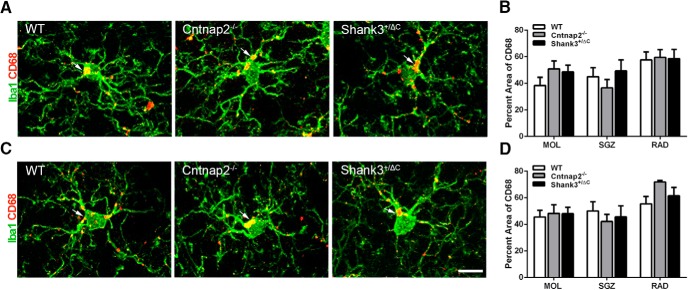
Figure 6.
No differences were detected in the percentage area of CD68 in Iba1+ cells across mouse autism models in the hippocampus. A, C, Representative images of sections double labeled with microglia marker Iba1 (green) and microglial lysosomal marker CD68 (red) from WT, Cntnap2−/−, and Shank3+/ΔC mice in the dorsal (A) and ventral (C) MOL of the dentate gyrus. Arrows point to CD68 aggregate labeling. Scale bar, 10 µm, applies to all frames. B, D, Quantification of the percentage area of CD68 in Iba1-labeled microglia cells in the dorsal (B) and ventral (D) hippocampus. Error bars represent the SEM.

