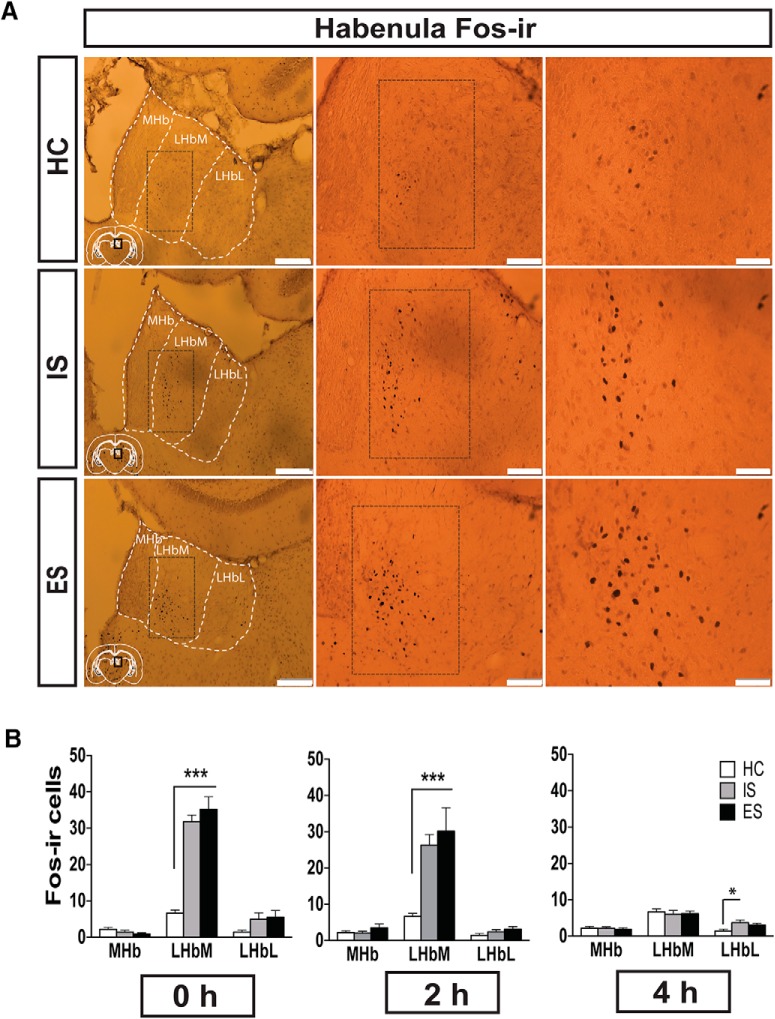
Figure 3.
Stress, per se, increases Fos-IR in the LHbM. A, Photomicrographs of Fos-IR in the habenula from rats that were killed 2 h after receiving HC (top), IS (middle), or ES (bottom). Images are shown at 10× (left), 20× (middle), and 40× (right) magnification. Scale bars: left, 200 μm; middle, 100 μm; and right, 50 μm. B, Fos-IR was examined in the habenula at 0, 2, and 4 h following HC, IS, or ES (left to right). n = 8/group, two habenula sections/rat at all time points.

