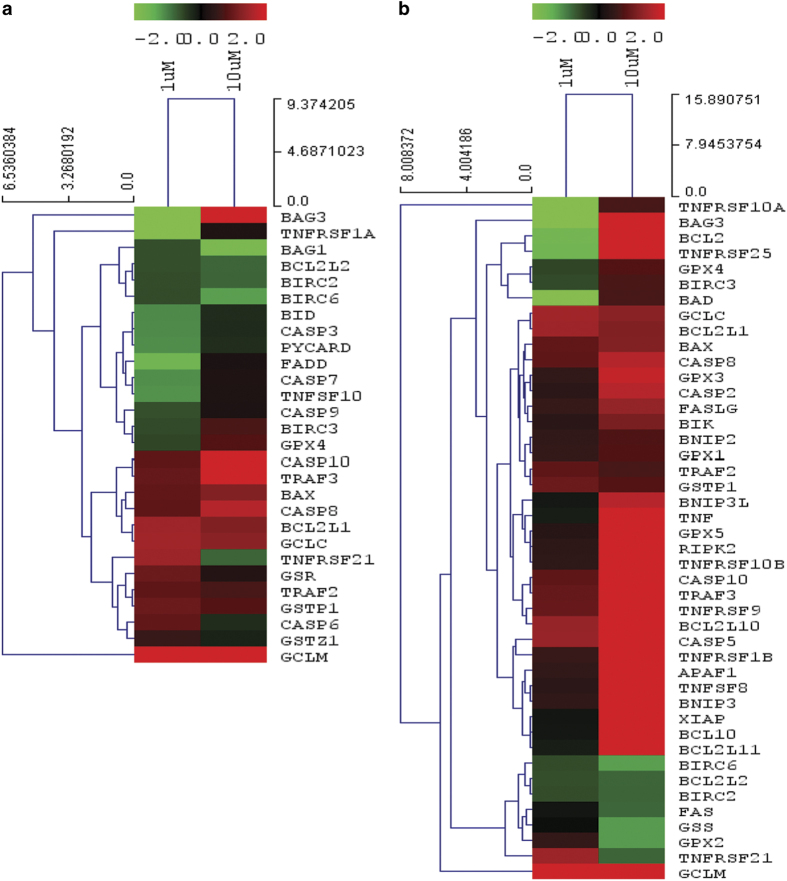
Figure 2.
Heat maps and hierarchical clusters of core apoptosis-related and glutathione metabolism-related genes up- and downregulated significantly in 1 μM (a) and 10 μM (b) arsenic-treated cells as compared with control. An arsenic treatment of 1 μM demonstrates 15 downregulated and 13 upregulated genes, whereas 10 μM treatment of arsenic-treated cells exhibits 37 upregulated and 7 downregulated genes as compared with control.

