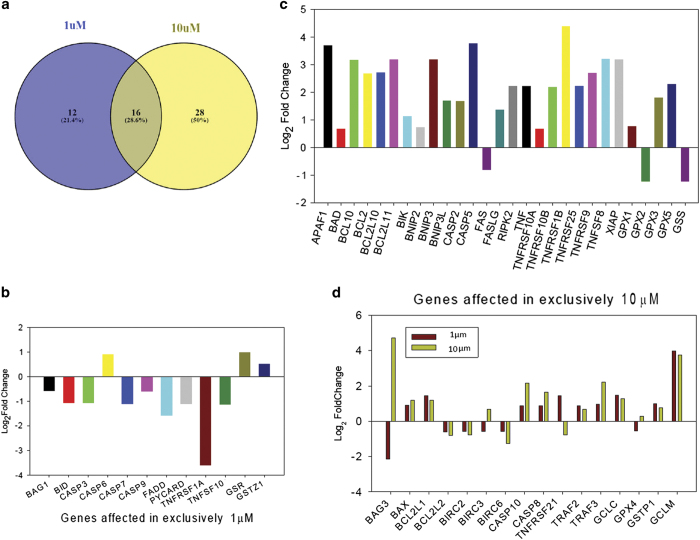
Figure 3.
(a) Venn diagram representing the overlap between the genes affected in 1 and 10 μM arsenic-treated cells. Twelve genes are affected (up/downregulated) exclusively at 1 μM and 28 genes are affected exclusively in 10 μM arsenic-treated cells. Sixteen genes are affected commonly in both the treatment concentrations. Magnitude of up/downregulated genes in 1 μM (b), 10 μM (c) and both (d) treatment concentration.

