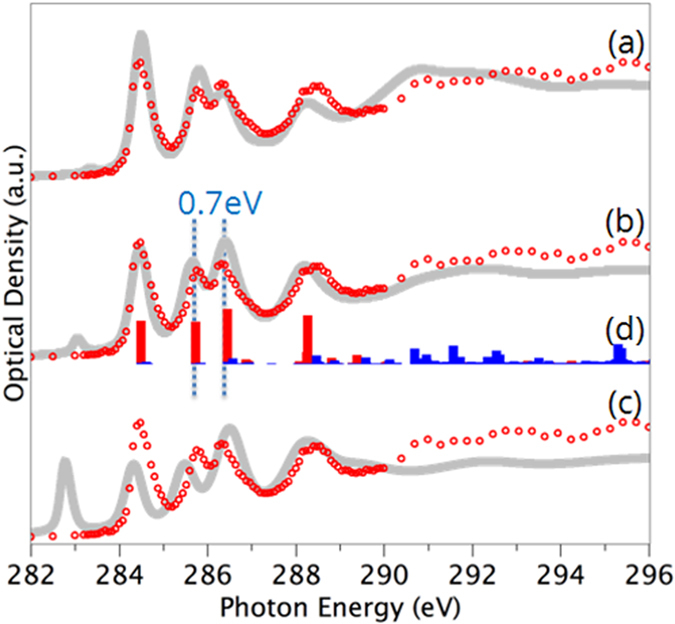
Figure 2. Carbon 1s spectrum of C60.

The experimental scanning transmission X-ray microscopy (STXM) data is plotted in red circles while the calculated spectra are gray lines. Calculations were performed with (a) full-core hole (final state), (b) half-core hole (Slater transition state) and (c) zero-core hole approximation (initial state). (d) Breakdown of calculated spectrum into π* (red) and σ* (blue) components.
