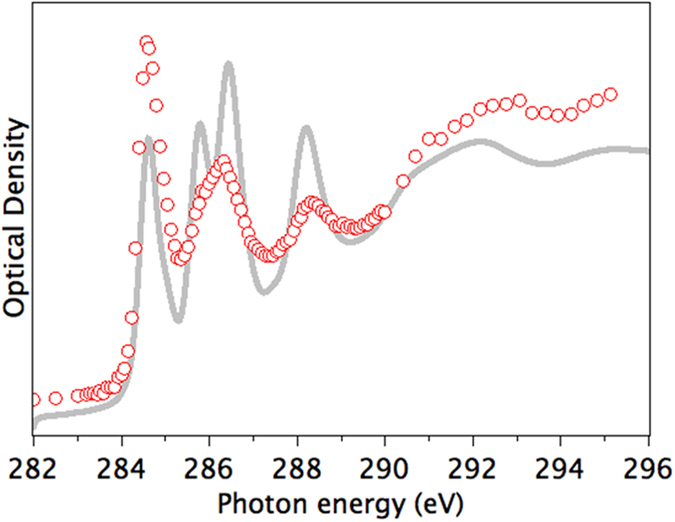
Figure 4. Carbon 1s spectrum of (C59N)2.

Experimental STXM data in red circles, calculated spectrum using the Slater transition state in gray is a weighted sum of individual atom spectra shown in Fig. 3.

Experimental STXM data in red circles, calculated spectrum using the Slater transition state in gray is a weighted sum of individual atom spectra shown in Fig. 3.