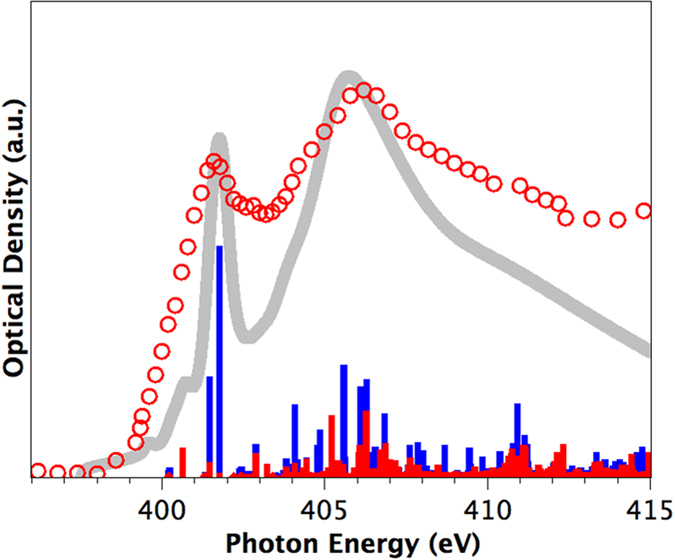
Figure 5. N 1s spectra of (C59N)2 azafullerene.

Experimental STXM data in red circles, calculated spectrum using the Slater transition state in gray, projection of calculated spectrum into π* (red) and σ* (blue) components.

Experimental STXM data in red circles, calculated spectrum using the Slater transition state in gray, projection of calculated spectrum into π* (red) and σ* (blue) components.