
Figure 1. Example images for a control subject (left) and MCI subject (right).
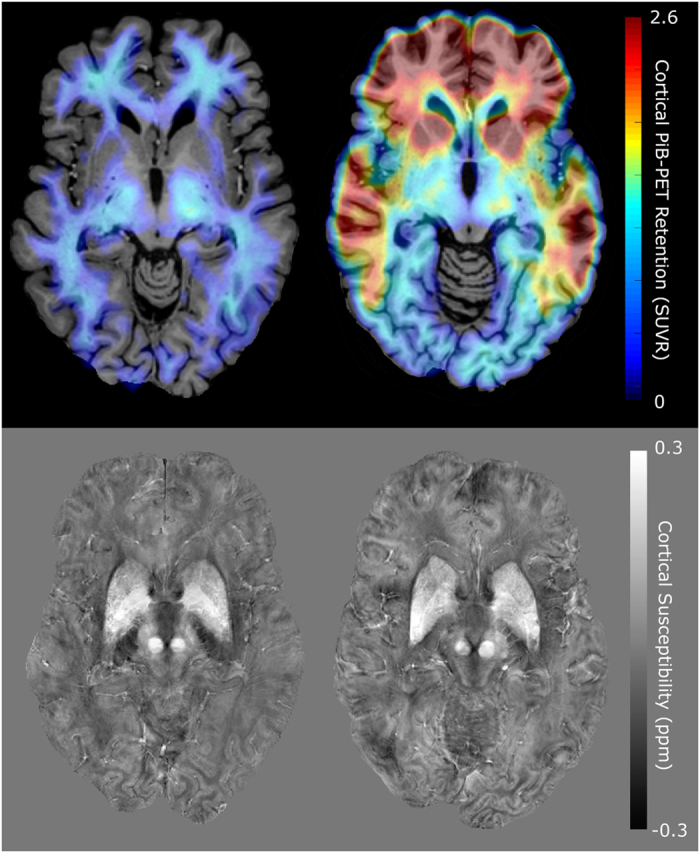
The top row shows PiB-PET images of Aβ-plaque-load in gray matter, which is highly increased in the frontal regions in the MCI subject, the signal in the white matter is non-specific to Aβ-plaque-load and is also observed in the control subject. The bottom row shows QSM maps of the same slices indicating regions with high iron load such as the basal ganglia.