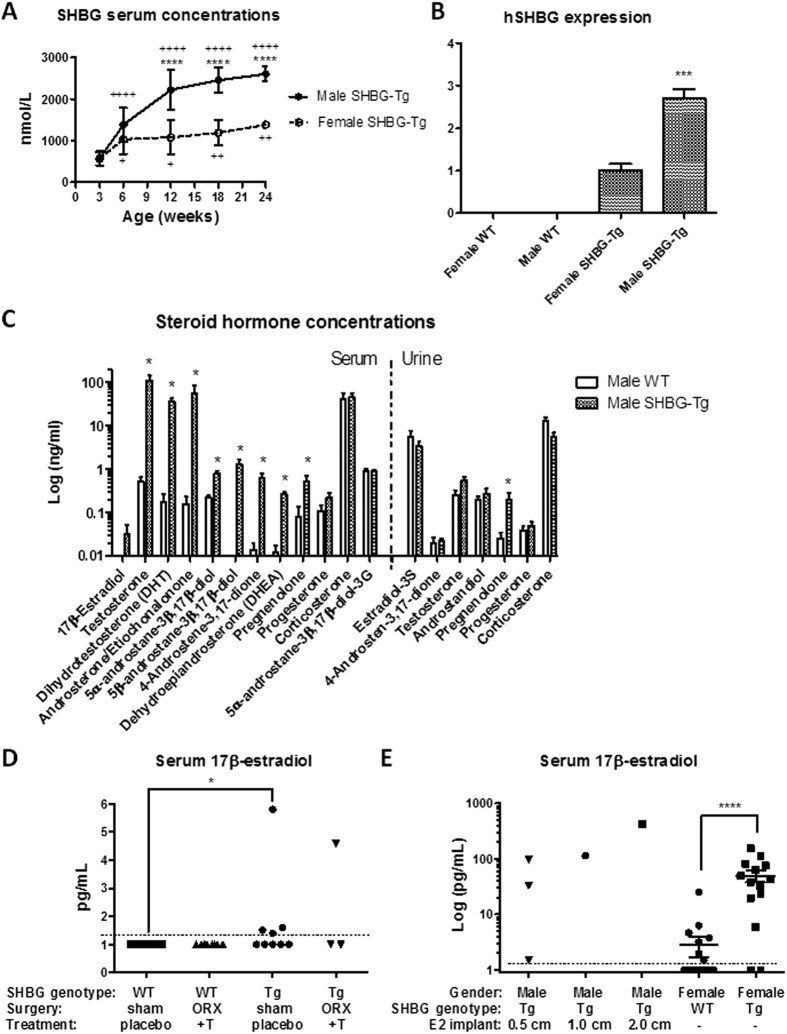
Figure 1. Endocrine profile of SHBG-Tg mice.
(A) Human SHBG serum concentrations (shown as mean ± SD) in male and female SHBG-Tg mice of different ages (n = 7–10 per gender and age except 24-week-old females, n = 3). ****P < 0.0001 vs. female SHBG-Tg mice of same age group. +P < 0.05, ++P < 0.01, ++++P < 0.0001 vs. 3-week-old mice of same gender. (B) Human SHBG expression (relative to mouse 18S) in livers of female and male WT and SHBG-Tg mice (n = 3 for WT and n = 5 for SHBG-Tg mice of each gender). ***P = 0.0002 for difference between SHBG-Tg females and males. (C) Concentrations in serum (left from vertical dotted line) and urine (right from vertical dotted line) of selected steroid hormones in 24-week-old WT and SHBG-Tg male mice (n = 5 per group). *P < 0.05 vs. WT mice. (D) Serum E2 in 12-week-old WT and SHBG-Tg male mice, either sham-operated and given empty placebo implants, or orchidectomized with continuous-release s.c. T replacement. The limit of quantification (LOQ) of the LC-MS/MS method (1.3 pg/mL) is indicated by the horizontal dotted line. *P < 0.05, n as indicated by individual replicates in each group. (E) Serum E2 in 12-week-old orchidectomized male mice given s.c. undiluted E2 implants of different lengths as indicated, or female WT and SHBG-Tg mice. The limit of quantification (LOQ) of the LC-MS/MS method (1.3 pg/mL) is indicated by the horizontal dotted line. ****P < 0.0001, n as indicated by individual replicates in each group.

