
Fig. 1.
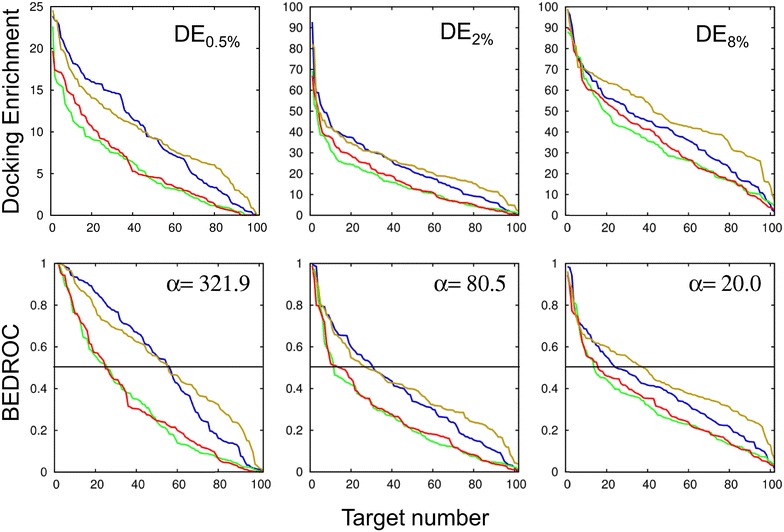
Two metrics to evaluate the performance of the programs with respect to the target number. Upper panels: the docking enrichments (DE) for three different percentiles of the chemical libraries, 0.5, 2 and 8 %. Lower panels: BEDROC scores for three α values, 321.9, 80.5 and 20.0. For each curve, the results are sorted in the descending order of DE or BEDROC, which means that the target number does not point to the same protein. The curves of Gold are in yellow, Glide in blue, Surflex in green and FlexX in red. In the lower panels, the horizontal lines represent BEDROC score = 0.5