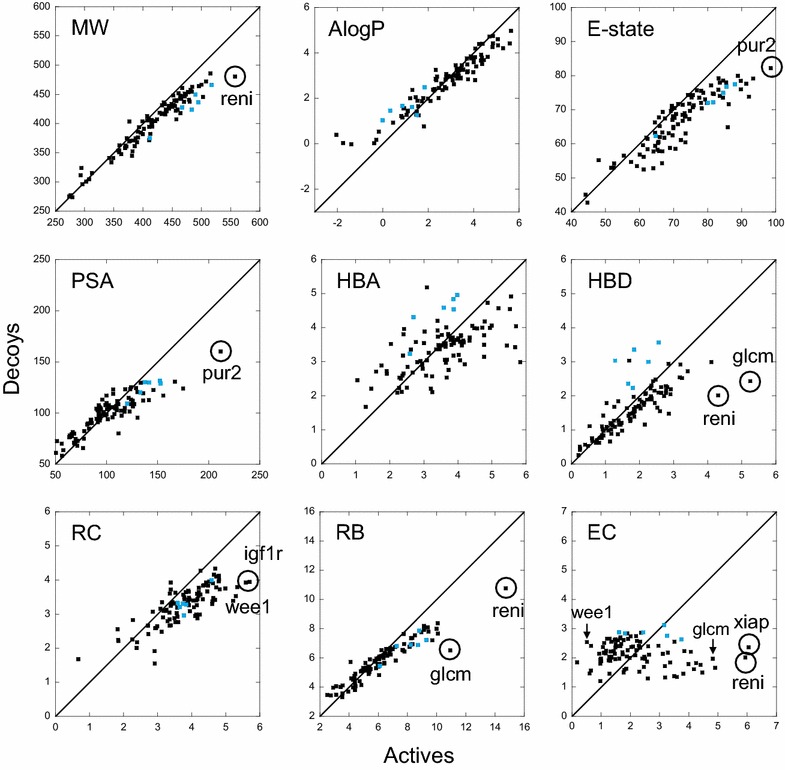
Fig. 6.

Properties of the small molecules. Each plot corresponds to one of the nine properties considered in this study. In all panels, for each target, the average property of the decoys is plotted versus the average of the same property for the actives. The blue dots correspond to the six proteins of the protease family. The diagonal line represents the ideal situation where the average property for the actives and decoys are equal. For some properties, the most stand-out targets are encircled
