
Fig. 7.
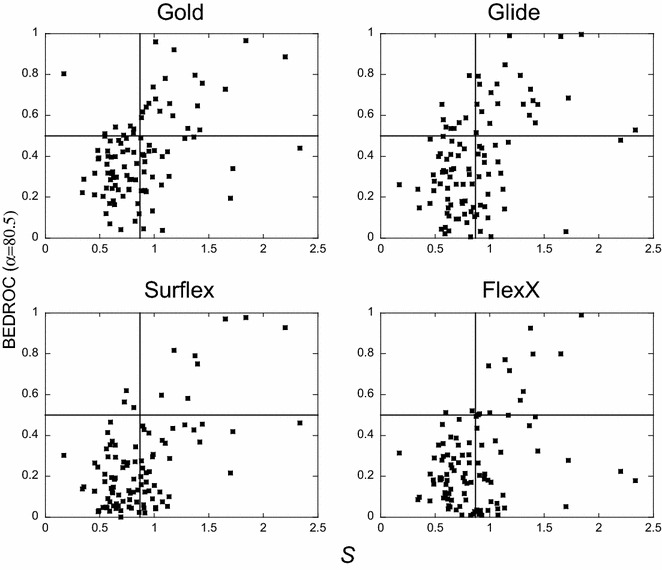
Programs performance with respect to the small molecule biases. For each target, the BEDROC score (α = 80.5) is plotted with respect to the sum, S, of the absolute values of the normalized differences between the actives and the decoys of all nine properties (see “Methods” section). The vertical line corresponds to the average of S over the 102 targets, 〈S〉 = 0.87, and the horizontal line, to BEDROC score = 0.5. In each plot, the dots in the upper left quadrant correspond to targets with low biases and high BEDROC scores