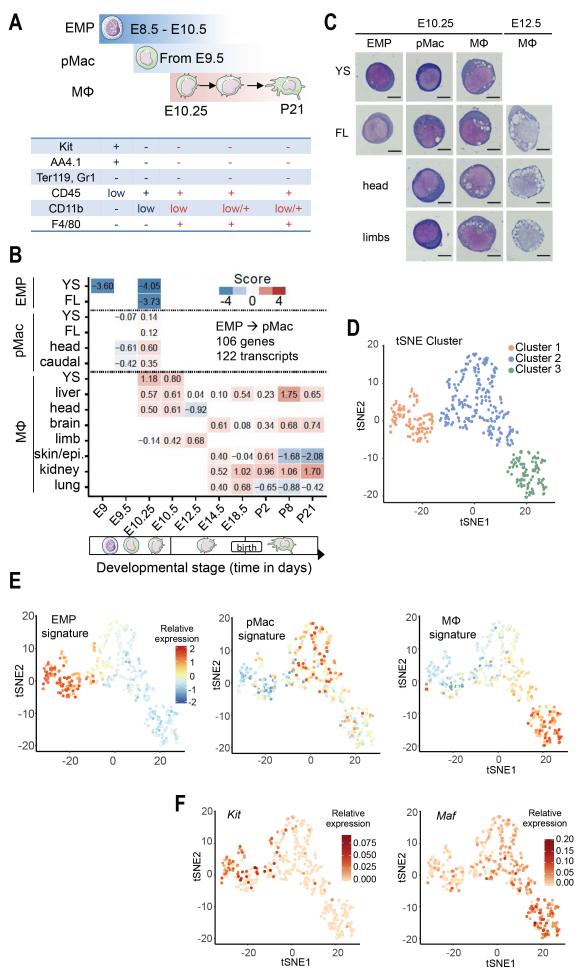
Fig. 1. A core macrophage program is initiated simultaneously in pMacs in all tissues.
(A) Summary of surface phenotype used for EMPs, pMacs, and macrophages. (B) Scorecard visualization of differentially upregulated genes (DESeq2 Wald test, adjusted p-value < 0.05, BH-correction) in pMacs (E9.5 and E10.25) in comparison to EMPs. The table shows the relative enrichment of differentially upregulated genes in pMacs across cell types and tissues (y-axis) and developmental time points (x-axis, from E9 to P21). See Table S1, Fig. S1, and Methods for details of the scorecard. (C) May-Gruenwald-Giemsa stained cytospin preparations of sorted EMPs, pMacs and early macrophages from yolk sac (YS), head, limbs and fetal liver (FL) at E10.25 and E12.5. n=3 independent experiments. (D) tSNE plot of scRNA-seq data showing distribution of CD45low/+ cells from E10.25 embryos into three clusters (see also Fig. S2). Cluster distribution based on DBScan is overlaid onto the graph. (E) Superimposition of EMP-, pMac-, or macrophage-specific signatures defined by the bulk RNA sequencing on the tSNE plot shown in D. (F) tSNE plot as in (D) overlaid with the relative expression values for Kit and Maf.

