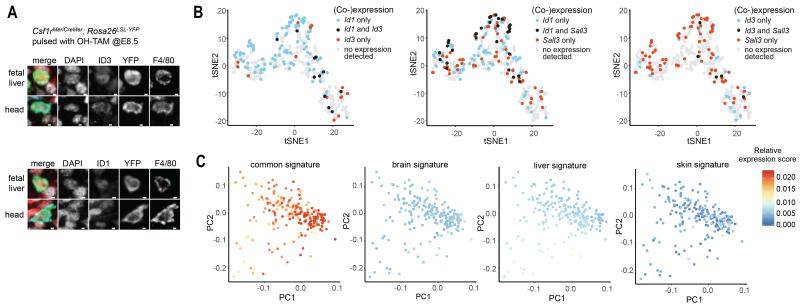
Fig. 6. Tissue-specific macrophage signatures are not detected in pMacs.
(A) Immunostaining with antibodies against Id1 or Id3 (red), F4/80 (cyan) and YFP (green) on cryosections from E10.25 Csf1rMeriCreMer; Rosa26LSL-YFP embryos (OH-TAM at E8.5) (upper panel). Nuclei are counterstained with DAPI (white). Scale bar represents 2 μm. (B) tSNE plots of scRNA-seq data from CD45low/+ cells from E10.25 embryo showing co-expression of Id1, Id3, and Sall3. See Fig. S11. (C) PCA plot of scRNA-seq data of cells from cluster 2 (pMacs) with superimposed fetal tissue macrophage-specific signatures. See Fig. S11, Table S2 and methods.

