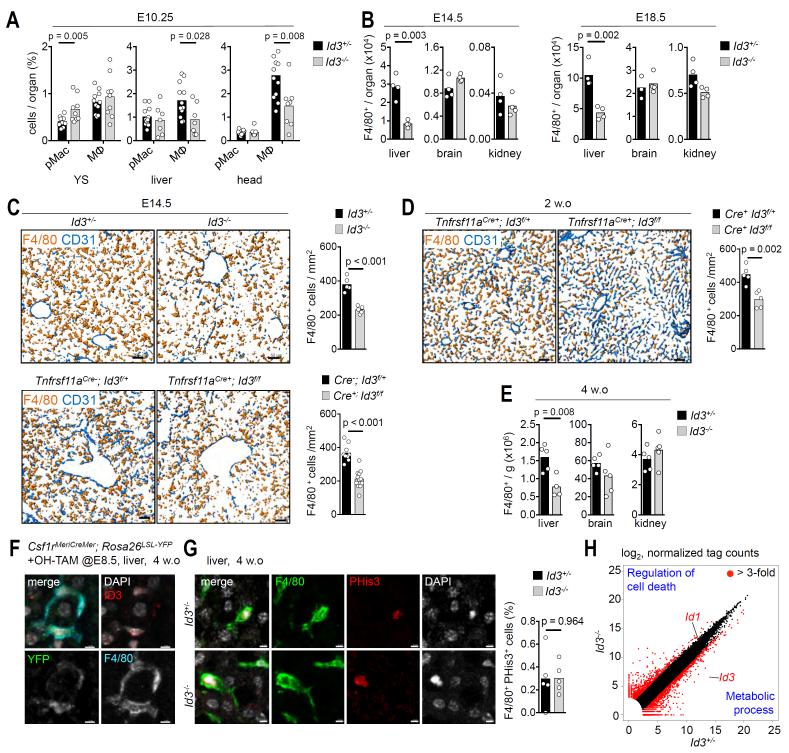
Fig. 7. Id3 is important for Kupffer cells development.
(A) Flow cytometry analysis of pMacs and macrophages in yolk sac (YS) and liver from E10.25 Id3−/− and Id3+/− embryos. Circles represent individual mice. n=3 independent experiments. (B) Flow cytometry analysis of F4/80+ macrophages in liver, brain and kidney from E14.5 and E18.5 Id3−/− and Id3+/− mice. Circles represent individual mice. n=4 independent experiments. (C) Immunostaining with antibodies against CD31 and F4/80 on liver cryosections from E14.5 Id3−/− and Id3+/−, and Tnfrsf11aCre−;Id3f/+ and Tnfrsf11aCre+; Id3f/f mice. The figure displays isovolume-rendered images. Bar graphs represent F4/80+ cells/mm2. Circles represent individual images. n=3 independent experiments. (D) Flow cytometry analysis of F4/80+ macrophages in liver, brain and kidney from 4 week-old Id3−/− and Id3+/− mice. Circles represent individual mice. n=2 independent experiments. (E) Immunostaining with antibodies against CD31 and F4/80 on liver cryosections from 2 week-old Tnfrsf11aCre+;Id3f/+ and Tnfrsf11aCre+; Id3f/f mice. The figure displays isovolume-rendered images. Bar graphs represent F4/80+ cells/mm2. Circles represent individual images. (F) Immunostaining with antibodies against Id3 (red), F4/80 (cyan) and YFP (green) on cryosections from on livers from 4 week-old Csf1rMeriCreMer; Rosa26LSL-YFP (OH-TAM at E8.5) mice. Nuclei are counterstained with DAPI (white). Scale bar represents 5 um. (G) Immunostaining with antibodies against F4/80 (green) phospho-histone 3 (PHis3, red) and DAPI (gray) on liver cryosections from 4 week-old Id3−/− and Id3+/− mice. Scale bar represents 10 um. Data are representative of 5 mice per genotype. Each dot represents the mean of PHis3+ cells (in %) of total F4/80+ found in 5 sampling areas (830 um2) for each individual liver. (H) Scatterplot comparison of gene expression of 3 week-old Id3−/− and Id3+/− Kupffer cells. Both axes (in log2 scale) represent normalized gene expression values (average value from three Id3+/− and two Id3−/− replicates). Red circles mark the 3-fold cut-off in both directions in gene expression level. Top GO terms for genes enriched in either Id3+/− or Id3−/− are indicated. P-values were calculated using Student’s t test..See also Fig. S12.

