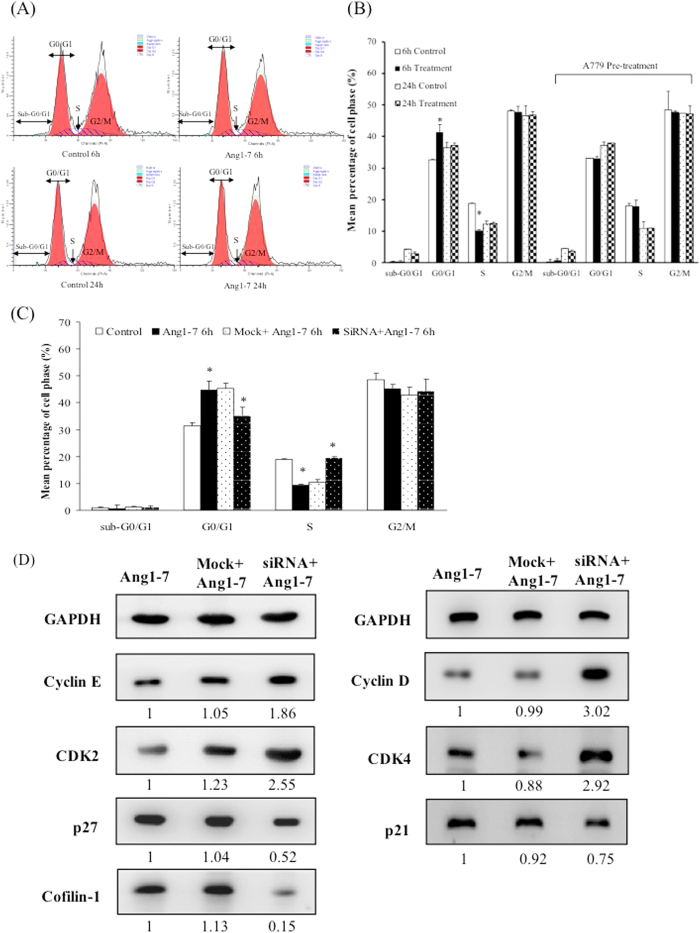
Figure 3. The cell cycle regulation induced by angiotensin-(1-7).
(A) After treatment with angiotensin-(1-7) for 6 h or 24 h, the HAECs were analyzed by flow cytometry. The X- and Y-axes are intensity of the PI staining and cell number, respectively. The data represent the distributions of the cells in the G0/G1, S, and G2/M phases. (B) Angiotensin-(1-7) treatment for 6 h induced G0/G1 phase arrest and decreased the number of cells in S phase; the G0/G1 arrest was attenuated by A779 pre-treatment. The data are expressed as the mean ± S.E.M. (n = 5) (C) The G0/G1 arrest were also attenuated by CFL1 siRNA pre-treatment. The data are expressed as the mean ± SEM (n = 5). (D) The cells were harvested for total protein determination, and the expression levels of p21, p27, CDK2, CDK4, CyclinD, CyclinE and Cofilin-1 were determined via western blots. The mock transfection was used as the control, and similar data were obtained from three independent experiments. *p < 0.05 indicates a significant difference relative to the 6-h control group.

