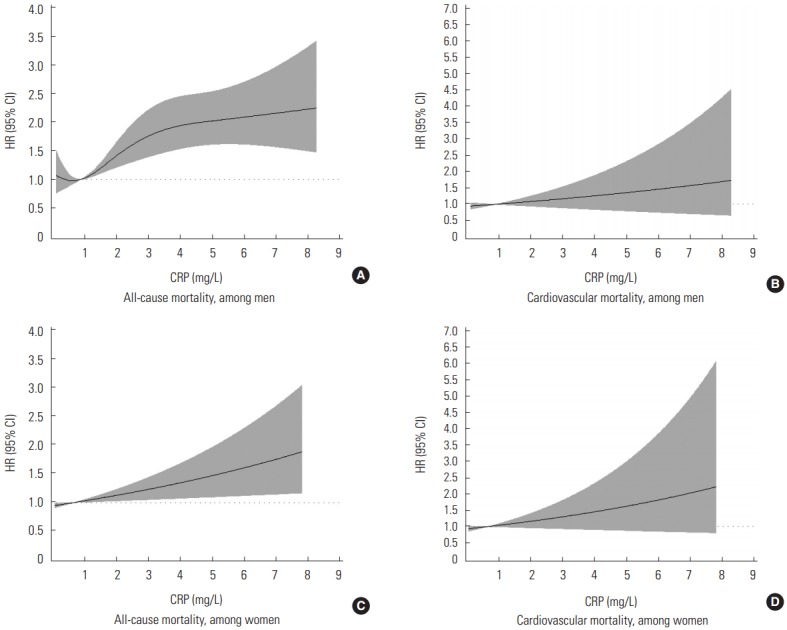
Figure 1.

The associations of CRP concentrations with HRs for all-cause mortality (A, C) and cardiovascular mortality (B, D). Knots were set at the 5th, 25th, 75th, and 95th percentiles, and the plot was truncated at the 1st and 99th percentiles. The median CRP level was used as the reference. HRs were adjusted for age, rural region, body mass index, educational status, alcohol use, smoking status, regular exercise, the presence of disease (hypertension, diabetes, and dyslipidemia), systolic blood pressure, diastolic blood pressure, fasting blood glucose, and concentrations of total cholesterol, triglycerides, and high-density lipoprotein cholesterol. In (A), the p-value for the non-linear relation was 0.048, so we show the spline model. In (C), the p-value for the non-linear relation was 0.267, but the p-value for the linear relation was 0.013, so we show the linear model. In (B) and (D), neither the linear nor the non-linear relation was significant (all p-values >0.05). In these cases, we show the linear model. CRP, C-reactive protein; HR, harzard ratio; CI, confidence interval.
