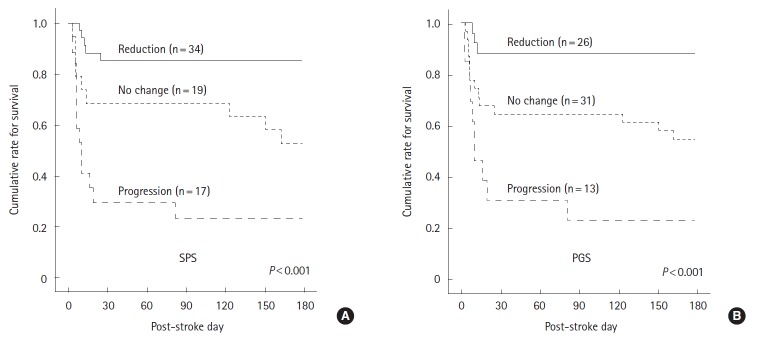
Figure 3.
Reduction in midline shift and 6-month survival outcomes. Kaplan-Meier curves showing the proportions of surviving patients stratified by the change in midline shift at the septum pellucidum (SPS, A) and at the pineal gland (PGS, B) after hemicraniectomy. The curves differed significantly according to the log-rank test.

