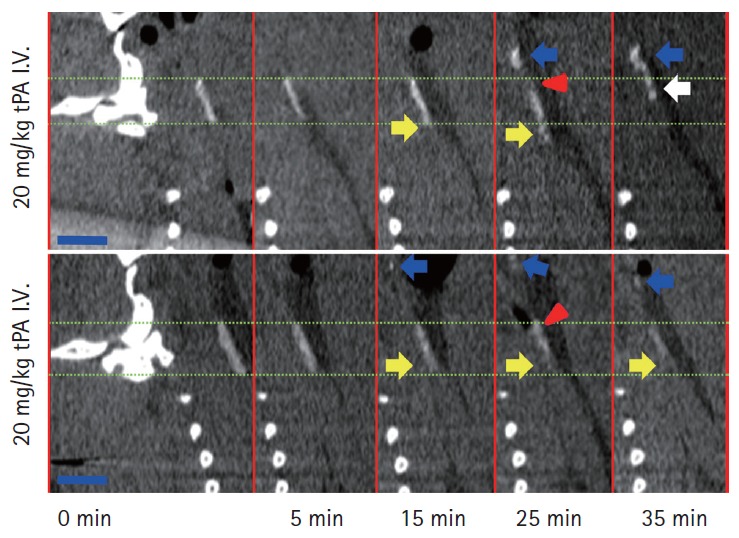
Figure 3.

Representative serial microCT images illustrating the dynamic nature of post-tissue plasminogen activator (tPA) thrombus evolution. In the lower-row animal, proximal thrombus growth (yellow arrows) is accompanied by distal thrombus resolution (red arrowhead) and embolization (blue arrows), followed by the distal migration of the entire thrombus body (white arrow). In the lower-row animal, proximal thrombus resolution (yellow arrows) is accompanied by distal thrombus growth (red arrowhead) and embolization (blue arrows). Scale bars=1 mm. I.V.=intravenous. Figure and caption reprinted from Kim et al. Ann Neurol (2013) [7] with permission.
