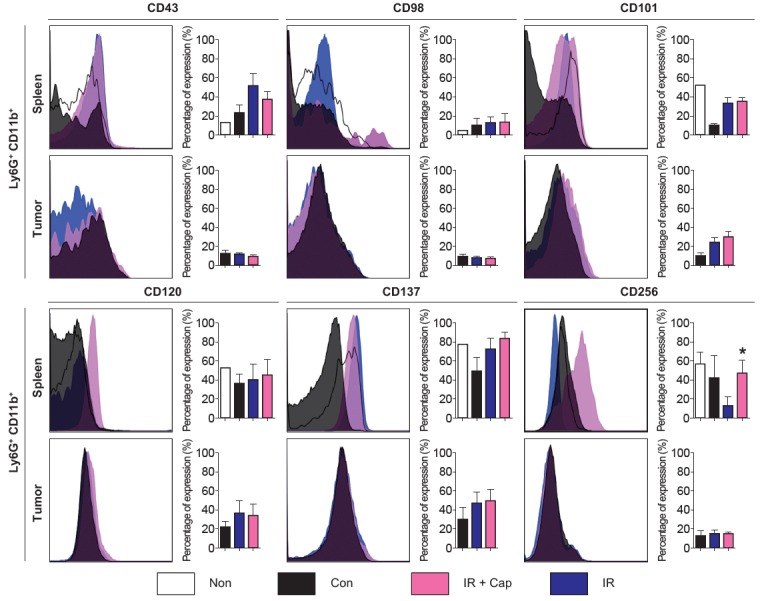
Fig. 3.

Phenotypic markers of splenic and intratumoral neutrophils (left, the representative flow cytometry histogram for each phenotypic marker; right, quantification of each phenotypic marker’s expression. All results are shown as mean ± standard error of mean. All the p-values between control and irradiated mice or between irradiated and irradiation plus captopril-treated mice were not reported if it was not significant (p ≥ 0.05). Non, mice without tumors; Con, control mice with tumor; IR + Cap, irradiation plus captopril-treated mice; IR, irradiated mice. n = 5–10 mice per each group; *p < 0.05 compared to irradiated mice.
