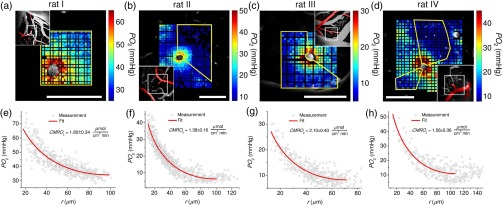
Fig. 2.
Baseline measurements. (a–d) Tissue maps (color coded) around penetrating arterioles overlaid on the corresponding FITC images of microvasculature in different animals (rats I to IV). Insets show MIPs of FITC-labeled microvasculature. Arterioles in insets are colored red. The white rectangle in each insert outlines the position of the corresponding panel with the data. Yellow lines outline regions of interest with data included in the fitting procedure. Imaging depths below brain surface are (rat I), (rat II), (rat III), and (rat IV). Scale bars, . (e–h) Tissue from the corresponding upper panels as a function of the radial distance from the penetrating arteriole with fit indicated by solid line.

