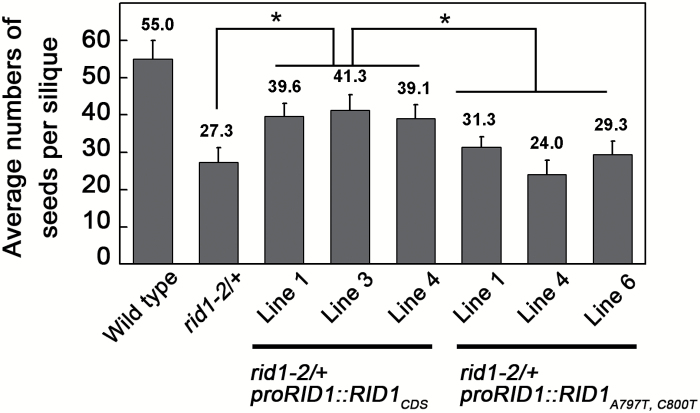
Fig. 6.
Analysis of the average number of seeds per siliques. Seeds in five sequential siliques from six independent wild-type, rid1-2/+ mutant, rid1-2/+ proRID1::RID1 CDS, and rid1-2/+ proRID1::RID1 A797T,C800T plants were counted. Data are presented as the mean ± standard deviation. Numbers above columns correspond to the average number of seeds per silique. * significant difference (Student’s t-test, P < 0.01).

